Fig. 9.
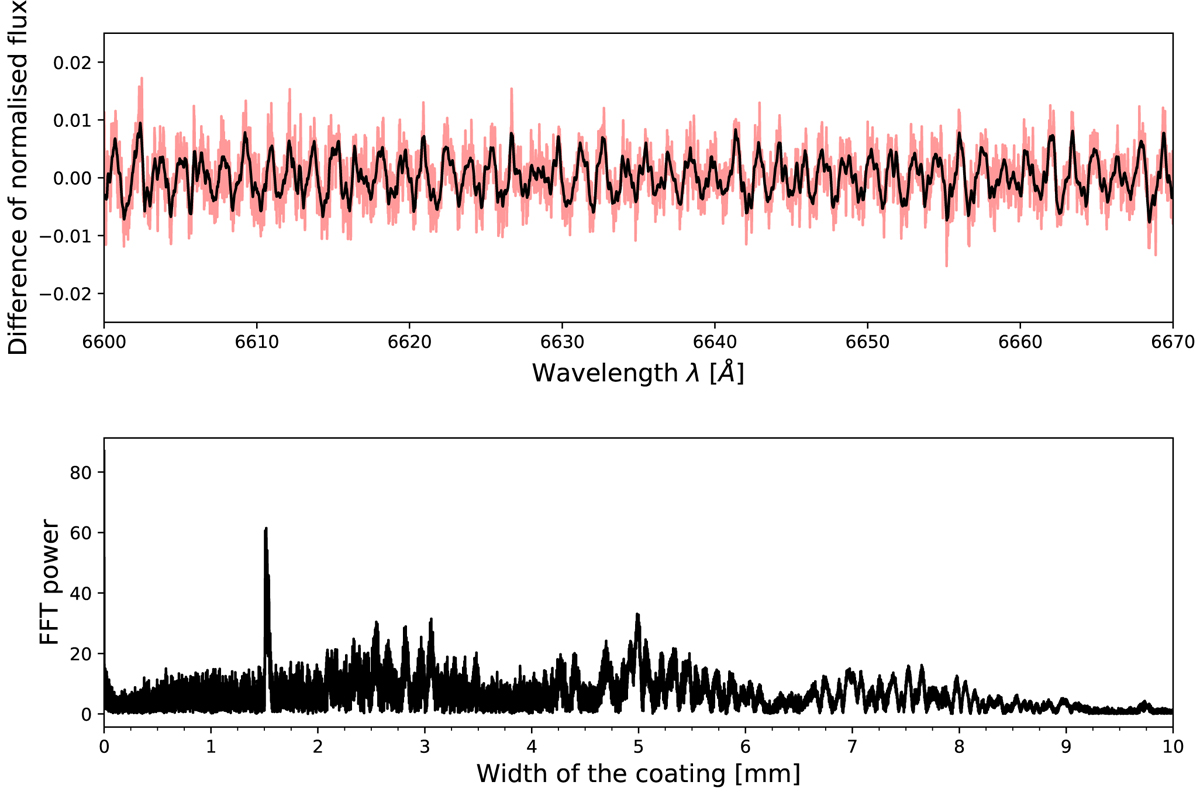
Top: zoom into the red 6640 Å region of the normalised spectral difference corresponding to the last red dot of the 2008 data set shown in the left panel of Fig. 8. A clear interference pattern is visible in the spectral difference (red curve) and is even more pronounced when the difference is smoothed (black curve). Bottom: fourier transform of the spectral difference. A power excess is visible and corresponds to an interference pattern created by an optical element of width 1.51 mm.
Current usage metrics show cumulative count of Article Views (full-text article views including HTML views, PDF and ePub downloads, according to the available data) and Abstracts Views on Vision4Press platform.
Data correspond to usage on the plateform after 2015. The current usage metrics is available 48-96 hours after online publication and is updated daily on week days.
Initial download of the metrics may take a while.