Fig. 8.
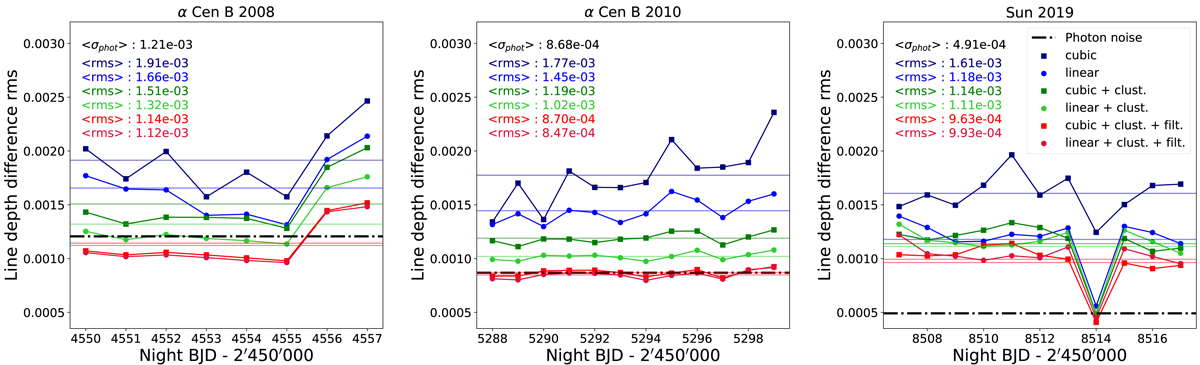
Measurement of the RASSINE line-depth precision using series of adjacent nights. The date of the first night forming a pair is indicated on the x-axis. For each night, the line depth was computed on the full spectrum, rejecting telluric regions. The weighted rms (coloured dots) was extracted from the distribution of the line-depth difference, where the difference is taken between two adjacent nights (see e.g. Fig. 7). The average rms ⟨rms⟩ on the night-to-night differences is measured and shown as horizontal solid lines. Left: 2008 α Cen B dataset. Middle: 2010 α Cen B dataset. Right: solar dataset.
Current usage metrics show cumulative count of Article Views (full-text article views including HTML views, PDF and ePub downloads, according to the available data) and Abstracts Views on Vision4Press platform.
Data correspond to usage on the plateform after 2015. The current usage metrics is available 48-96 hours after online publication and is updated daily on week days.
Initial download of the metrics may take a while.