Fig. 7.
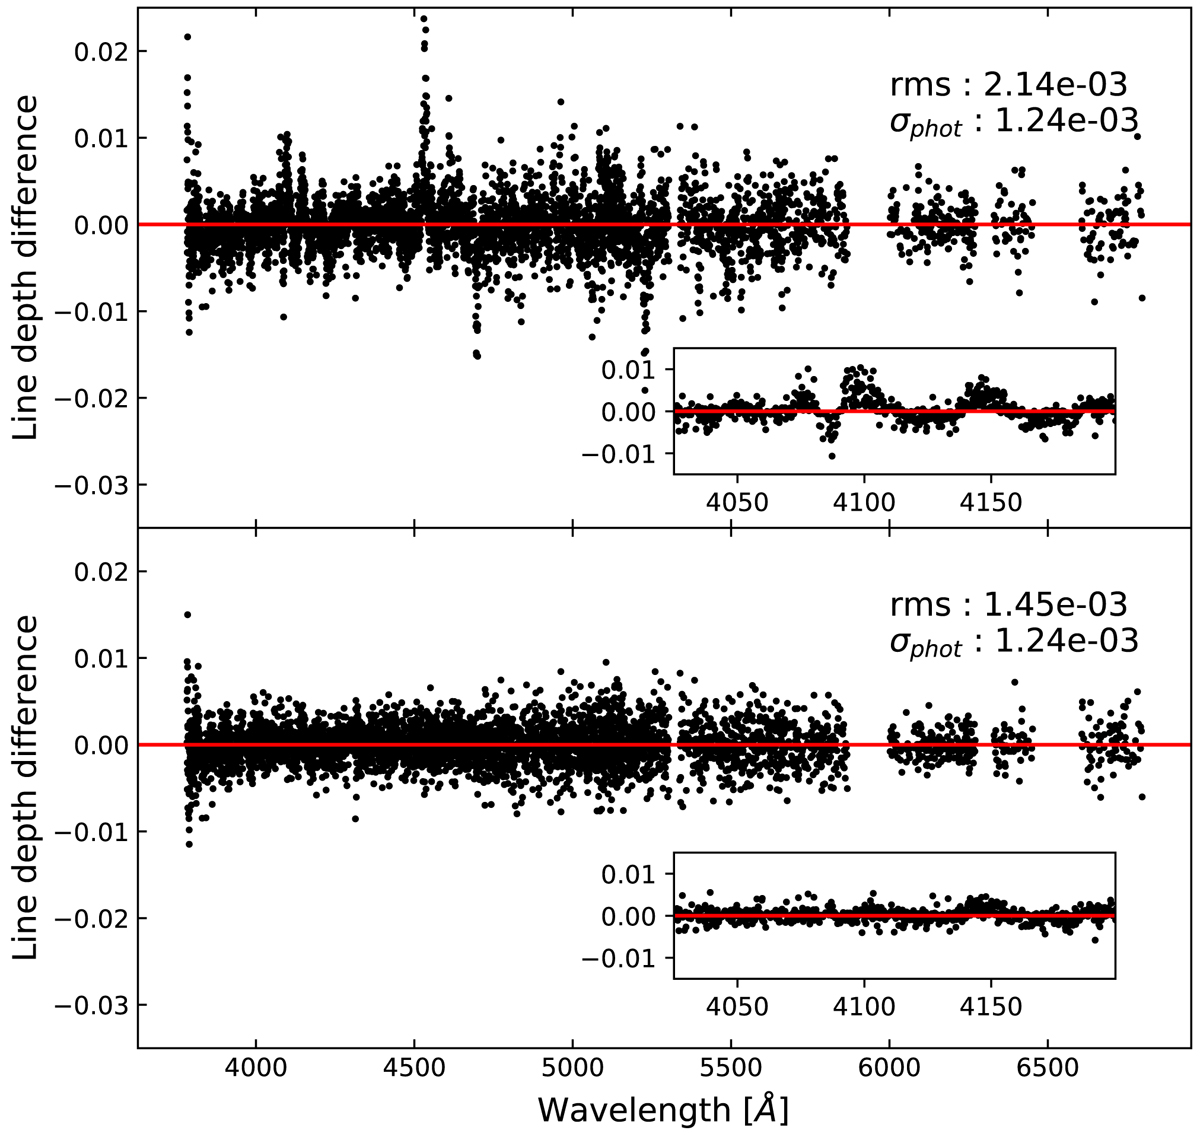
Line-depth difference between two α Cen B spectra taken one night apart (BJD = 2454557 and BJD = 2454558). The uncertainties from the photon noise are not displayed for clarity, but their median value σphot is indicated, as is the weighted rms used to measure the dispersion. Both spectra are normalised by the RASSINE cubic continuum, which is the least precise continuum (see Fig. 8). Top: line-depth difference when both spectra are normalised by the cubic continuum. This result matches the eighth square blue data point in the left panel of Fig. 8 and was the least precise result, with a line-depth precision of 0.21%. Part of the jitter is not Gaussian, as displayed in the inner plot, which is a zoom at 4100 Å, where the discrepancy is observed to be about 1.0%. The structures observed are induced by the cubic spline interpolation. Bottom: same as the top panel after performing clustering and low-frequency filtering (see Sect. 2.4). This result matches the eighth square red data point in the right panel of Fig. 8. The remaining jitter of 0.15% is dominated by the interference pattern (see Fig. 9).
Current usage metrics show cumulative count of Article Views (full-text article views including HTML views, PDF and ePub downloads, according to the available data) and Abstracts Views on Vision4Press platform.
Data correspond to usage on the plateform after 2015. The current usage metrics is available 48-96 hours after online publication and is updated daily on week days.
Initial download of the metrics may take a while.