Fig. 6.
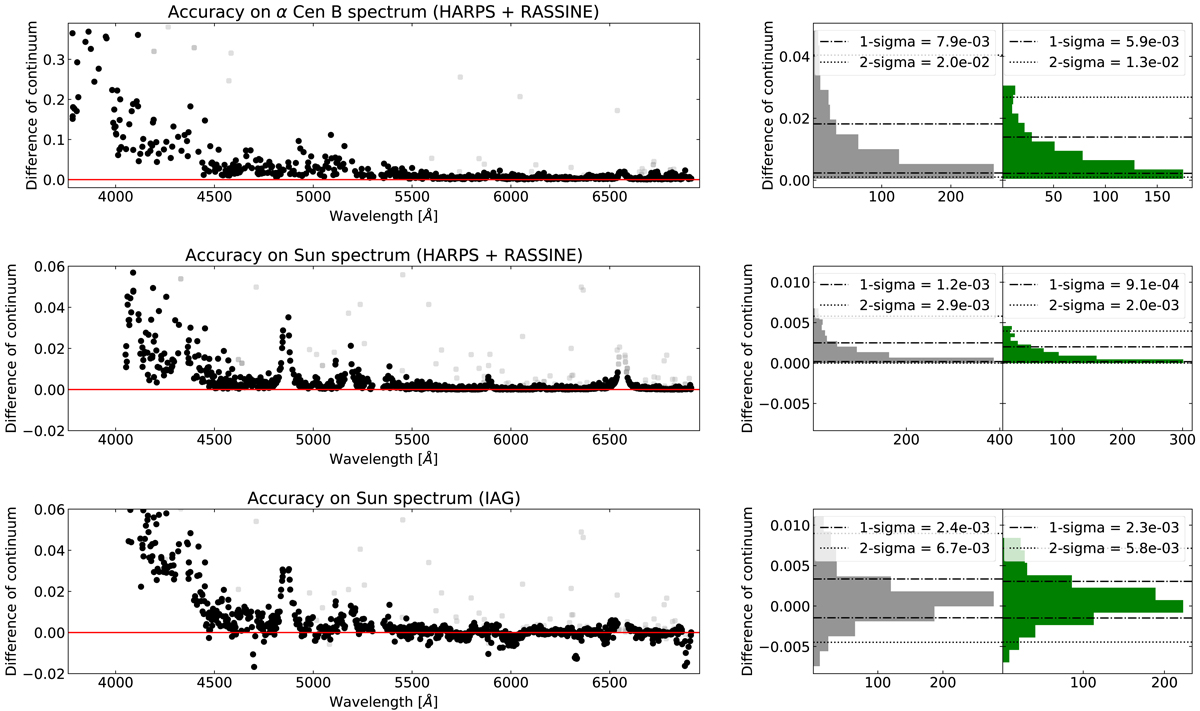
Computation of the RASSINE continuum accuracy by measuring the continuum difference level between our spectra and synthetic stellar templates. First row: difference of the continuum for α Cen B in the MARCS template and the RASSINE normalised spectrum as a function of wavelength. A few continuum differences cannot be extracted correctly in the synthetic template because some stellar lines are absent from our spectra (grey dots). The distribution of the continuum difference is plotted on the right (grey histogram), as is the distribution for λ > 4500 Å (green histogram). Second row: difference of the continuum for the Sun in the ATLAS template and the RASSINE normalised spectrum. Third row: difference of the continuum for the Sun in the ATLAS template and the IAG normalised solar atlas. The IAG solar atlas was normalised with a low-order polynomial fit.
Current usage metrics show cumulative count of Article Views (full-text article views including HTML views, PDF and ePub downloads, according to the available data) and Abstracts Views on Vision4Press platform.
Data correspond to usage on the plateform after 2015. The current usage metrics is available 48-96 hours after online publication and is updated daily on week days.
Initial download of the metrics may take a while.