Fig. 4.
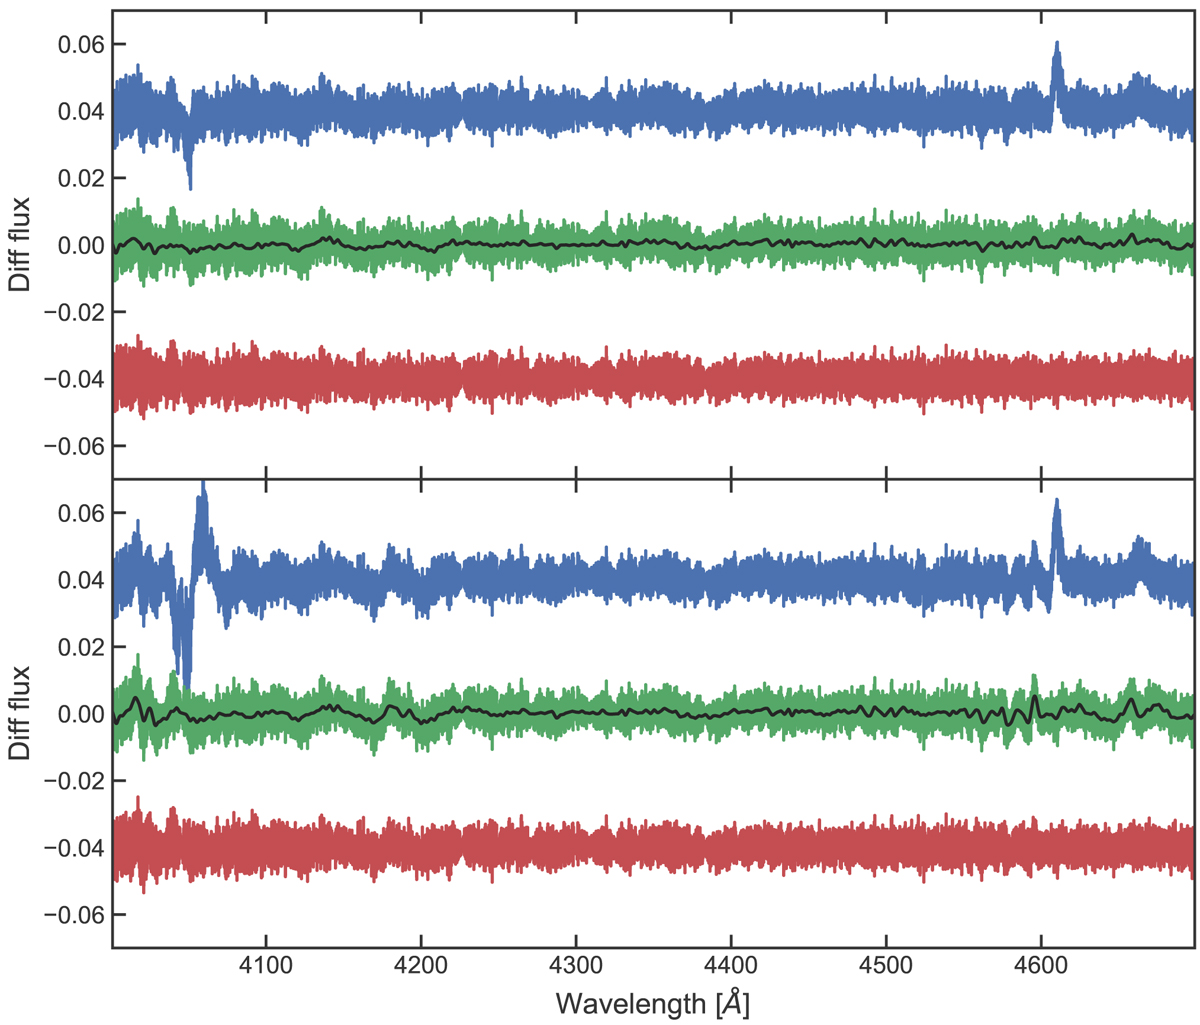
Visualisation of the wiggles produced in a difference of normalised spectra (blue curve) with an arbitrary zero-point. The two spectra come from the same star and are taken one night apart. Top: difference between the spectra normalised by the linearly interpolated continuum. Bottom: same as the top for the cubic interpolation. The green curve shows the improved stability that is reached with the clustering algorithm (see main text). The black curve shows the remaining fluctuations, and the red curve plots the residuals after those fluctuations are suppressed by the low-pass filter.
Current usage metrics show cumulative count of Article Views (full-text article views including HTML views, PDF and ePub downloads, according to the available data) and Abstracts Views on Vision4Press platform.
Data correspond to usage on the plateform after 2015. The current usage metrics is available 48-96 hours after online publication and is updated daily on week days.
Initial download of the metrics may take a while.