Fig. 3.
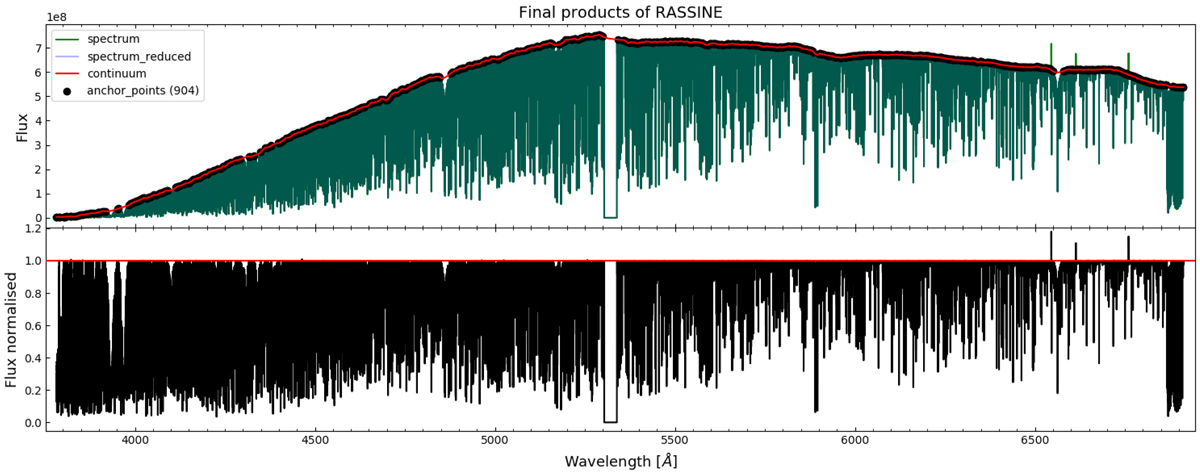
Final plot of the GUI. Top: initial solar spectrum given as input to RASSINE (green curve), as well as the continuum (red curve) as computed by RASSINE in complete automatic mode (see Appendix B). This continuum is derived using a cubic interpolation over a selection of relevant local maxima that are also called anchor points (black dots). The continuum avoids three spurious peaks due to simulated cosmic rays at 6550, 6600, and 6750 Å and jumps above the large absorption regions. Bottom: spectrum normalised with RASSINE.
Current usage metrics show cumulative count of Article Views (full-text article views including HTML views, PDF and ePub downloads, according to the available data) and Abstracts Views on Vision4Press platform.
Data correspond to usage on the plateform after 2015. The current usage metrics is available 48-96 hours after online publication and is updated daily on week days.
Initial download of the metrics may take a while.