Fig. D.7.
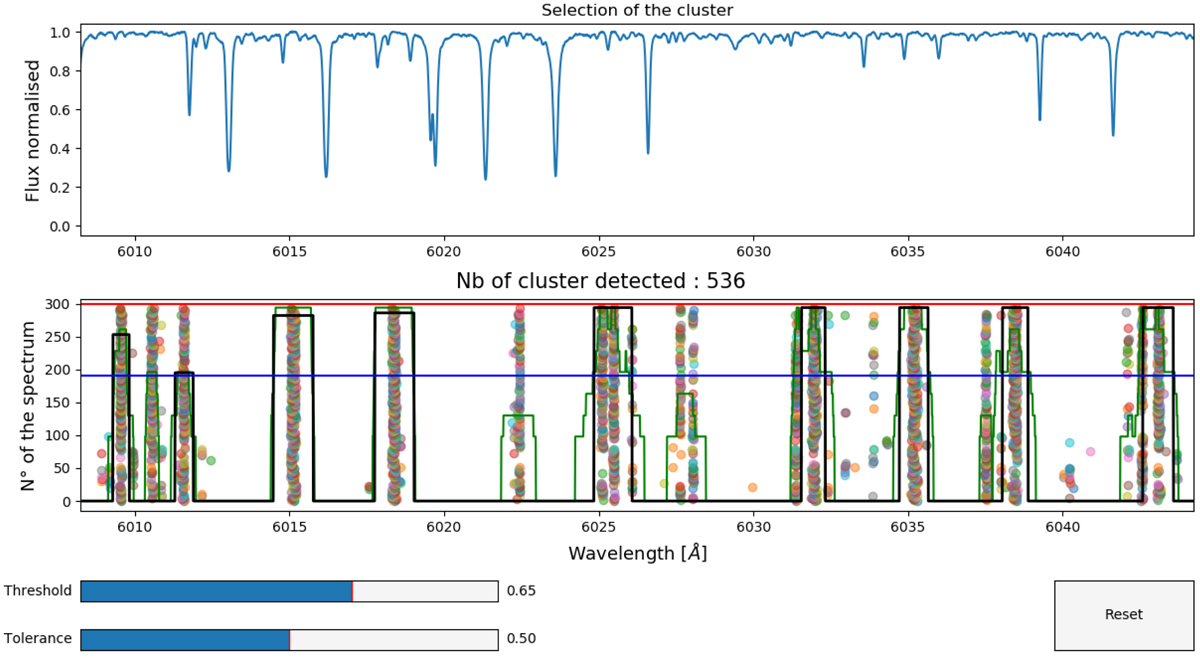
First optional function of RASSINE (intersect_all_continuum) for reducing spectral time series and stabilising the derived continuum. The anchor points of all the spectra are plotted (colour dots). The density is represented by the green curve. The detected clusters are those with a density higher than the threshold (horizontal blue line) and are represented by the black boxes. This step rejects spurious anchor points such as selected around 6040 Å.
Current usage metrics show cumulative count of Article Views (full-text article views including HTML views, PDF and ePub downloads, according to the available data) and Abstracts Views on Vision4Press platform.
Data correspond to usage on the plateform after 2015. The current usage metrics is available 48-96 hours after online publication and is updated daily on week days.
Initial download of the metrics may take a while.