Fig. 2.
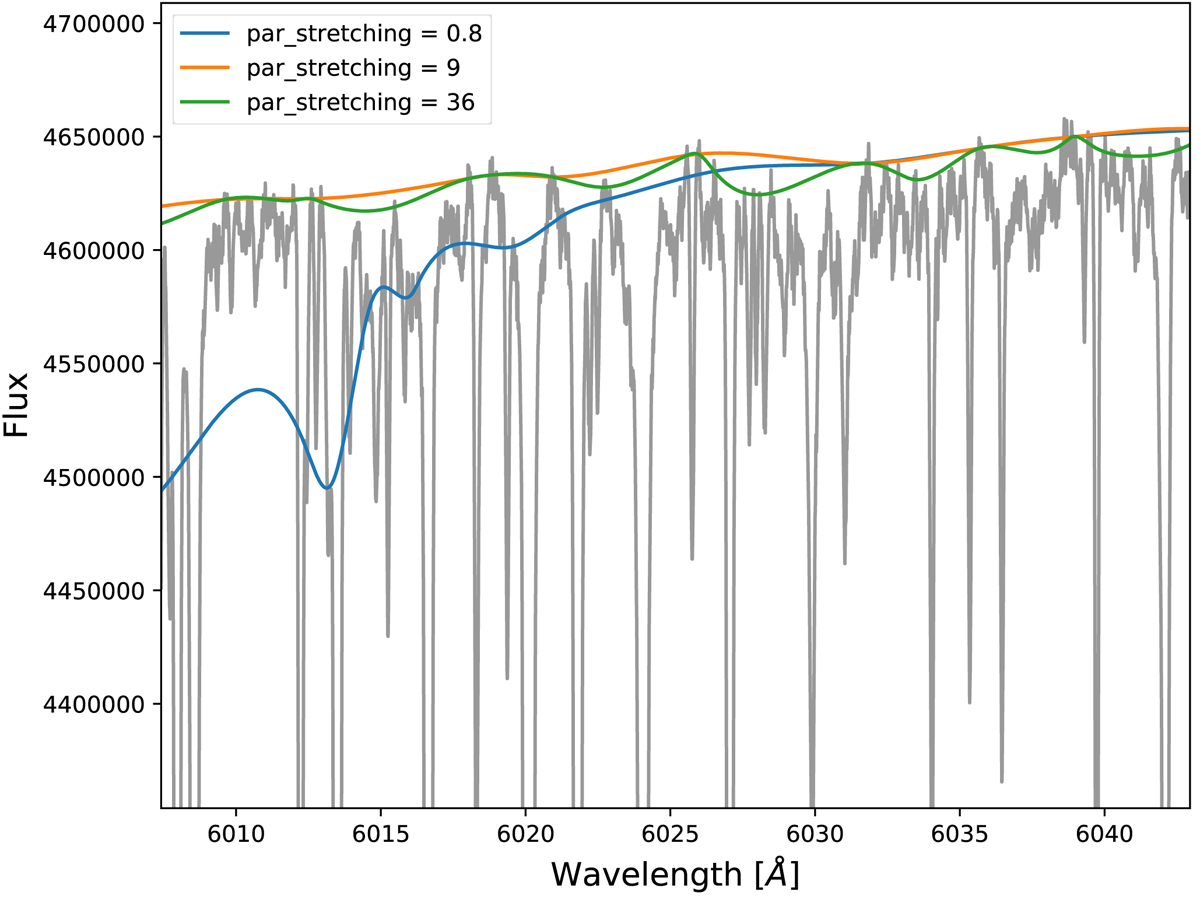
Effect of different values for par_stretching on the normalisation of the spectrum (grey curve). When par_stretching is too small (blue curve), the alpha shape falls on the blended local maxima. As soon as par_stretching is sufficiently high (orange curve), the alpha-shape approach provides a good normalisation. A wide range of values (orange and green curves) can provide a good normalisation below the 1% level.
Current usage metrics show cumulative count of Article Views (full-text article views including HTML views, PDF and ePub downloads, according to the available data) and Abstracts Views on Vision4Press platform.
Data correspond to usage on the plateform after 2015. The current usage metrics is available 48-96 hours after online publication and is updated daily on week days.
Initial download of the metrics may take a while.