Fig. B.3.
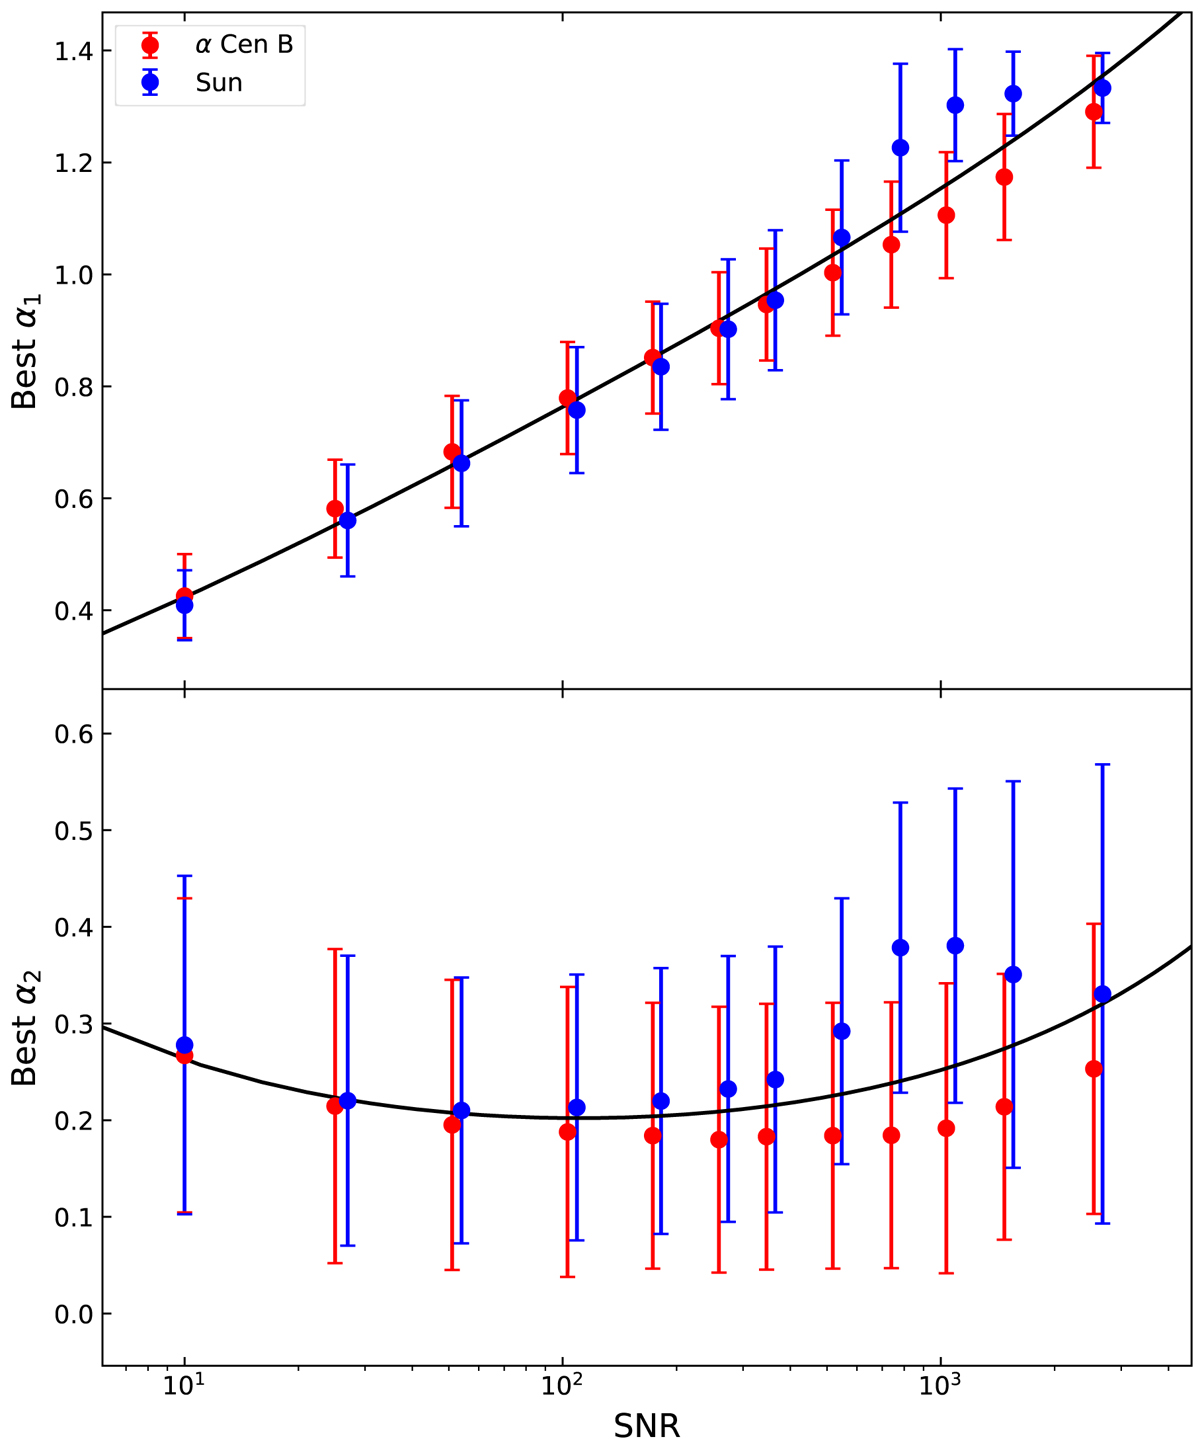
Calibration curves of the α1 and α2 parameters depending on the S/N value of a spectrum for the erf Fourier filter. Top: calibration of α1. The dots represent the best value according to the simulations (see Fig. B.2) that produce the least standard deviation (weighted, as explained in the text) between the noise-free and the smoothed spectrum. The error bars correspond to the 5% best values of the simulations. Two stars were used for the calibration (highlighted by the colour of the points). The calibration curves were fitted by a third-degree polynomial function in log-log space. Bottom: calibration of α2 with the same procedure. The calibration curves were fitted by a second-degree polynomial function in log-log space.
Current usage metrics show cumulative count of Article Views (full-text article views including HTML views, PDF and ePub downloads, according to the available data) and Abstracts Views on Vision4Press platform.
Data correspond to usage on the plateform after 2015. The current usage metrics is available 48-96 hours after online publication and is updated daily on week days.
Initial download of the metrics may take a while.