Fig. B.2.
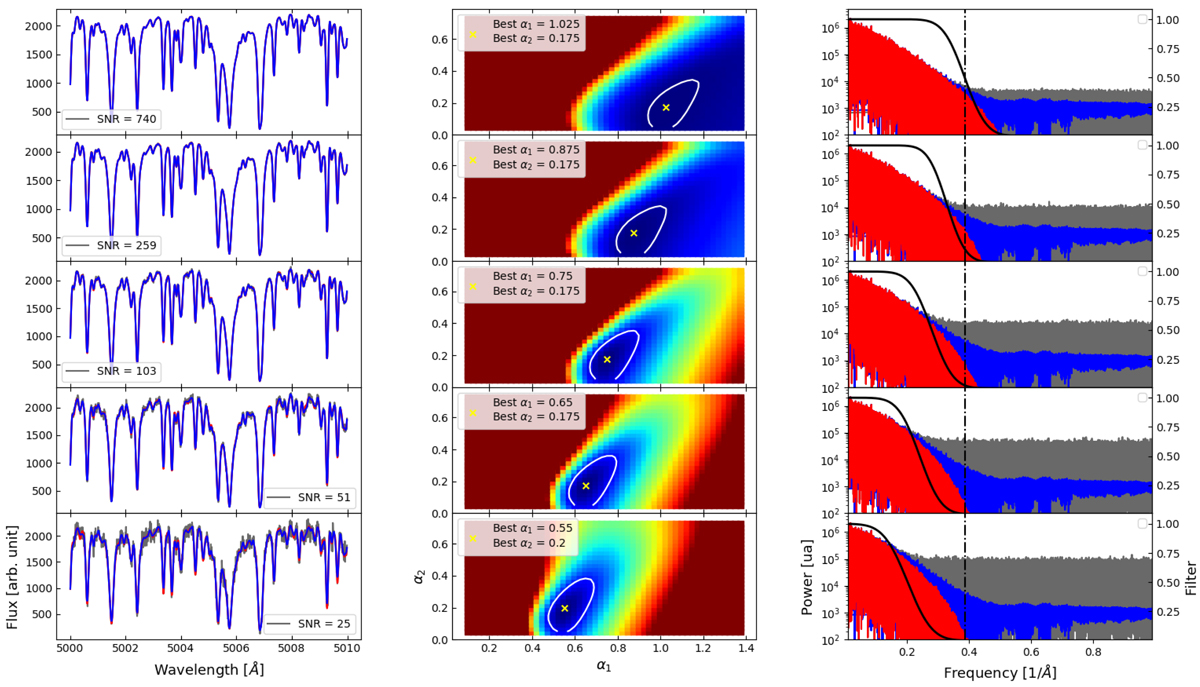
Calibration of α1 and α2 as a function of the spectrum S/N for the erf Fourier filter. Left: high S/N (∼12 000) spectrum of α Cen B (blue curve) is considered to be noise free. Different realisations of Poisson noise are generated (grey curves) in order to determine the best pair (α1, α2) whose corresponding smoothed curve (red curve) is most similar to the original curve. Only a subpart of the spectra is displayed for graphical considerations. Middle: (α1, α2) parameter space for different S/N realisations. The simulations were run on a grid of evenly spaced values of α1 and α2. The colours encode the metric used here, i.e. the standard deviation between the smoothed and noise-free spectrum. The local minimum of the parameter space is indicated by a yellow cross, and the contour level of the 5% best simulations is drawn in white. The noisier the spectrum, the lower the best α1. The best value for α2 appears rather constant around 0.175. Right: fourier transform of the spectra of the middle column (blue curve). The high-frequency noise (grey curve) increases significantly from S/N = 740 to S/N = 25 such that the centre of the erf function moves towards shorter frequencies. The erf filter corresponding to the best (α1, α2) pair is displayed (black curve). The red curve is the Fourier transform after smoothing by the function. The typical frequency scale σ−1, where the sigma is the width of the Gaussian fitted to the stellar CCF, is shown as a dashed vertical line.
Current usage metrics show cumulative count of Article Views (full-text article views including HTML views, PDF and ePub downloads, according to the available data) and Abstracts Views on Vision4Press platform.
Data correspond to usage on the plateform after 2015. The current usage metrics is available 48-96 hours after online publication and is updated daily on week days.
Initial download of the metrics may take a while.