Fig. 1.
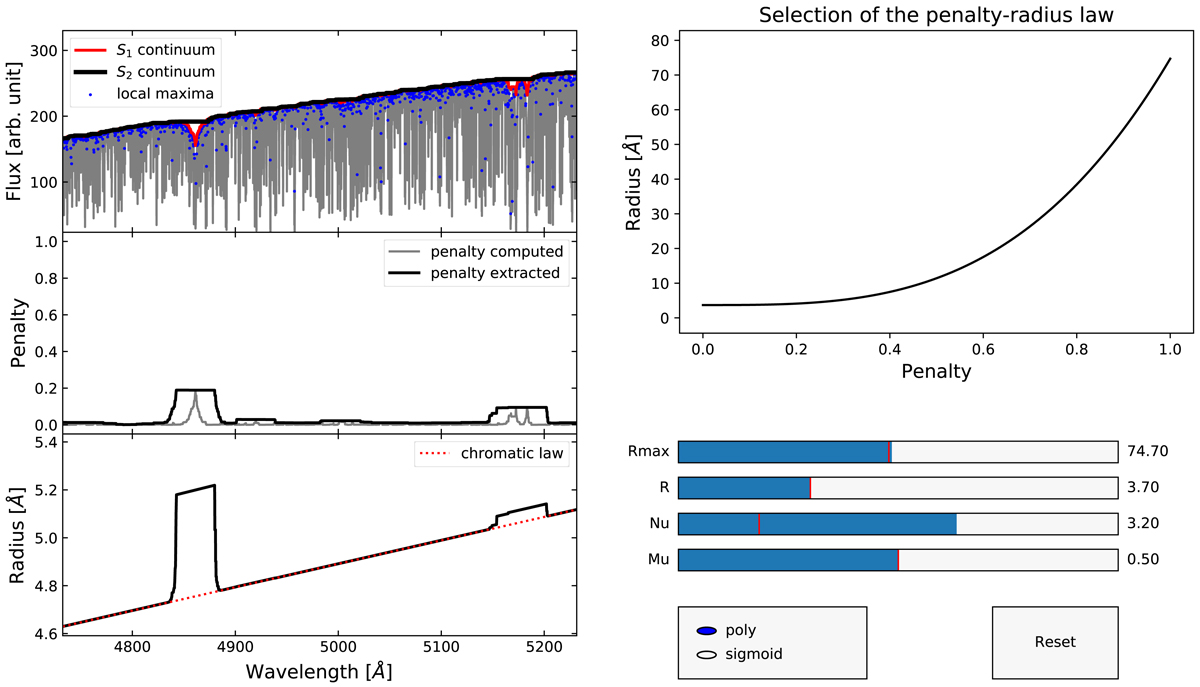
Second GUI of RASSINE that is used to define the varying radius of the alpha shape. In this case, the values for the parameters are bad (ν too high), but they are chosen to highlight the dependence of the radius on wavelength. Top left: local maxima (blue dots) extracted from the smoothed spectrum (grey curve). A continuum S1 using a small window (red curve) and S2 using a large window (black curve) are computed with a rolling maximum on the spectrum. Middle left: penalty computed from the relative difference between S1 and S2 (grey curve). The penalty is rounded and looks like a step function (black curve). Bottom left: final radius values for the rolling pin along the wavelength axis. Broader absorption lines such as Hβ at 4861 Å or the MgI triplet around 5172 Å are penalized such that the rolling pin increases in size. The observed linear trend corresponds to the dispersion because all spectral lines at first order have the same line width in velocity space. Top right: penalty map relation between the radius of the rolling pin and the penalty value. The curve is parametrised with a minimum radius R, a maximum radius Rmax, and an exponent ν that represents the exponent of the power law. The second parameter μ is only useful when the sigmoid function is selected for the penalty map and represents the centre of the sigmoid (ν being proportional to the sigmoid width).
Current usage metrics show cumulative count of Article Views (full-text article views including HTML views, PDF and ePub downloads, according to the available data) and Abstracts Views on Vision4Press platform.
Data correspond to usage on the plateform after 2015. The current usage metrics is available 48-96 hours after online publication and is updated daily on week days.
Initial download of the metrics may take a while.