Fig. 5
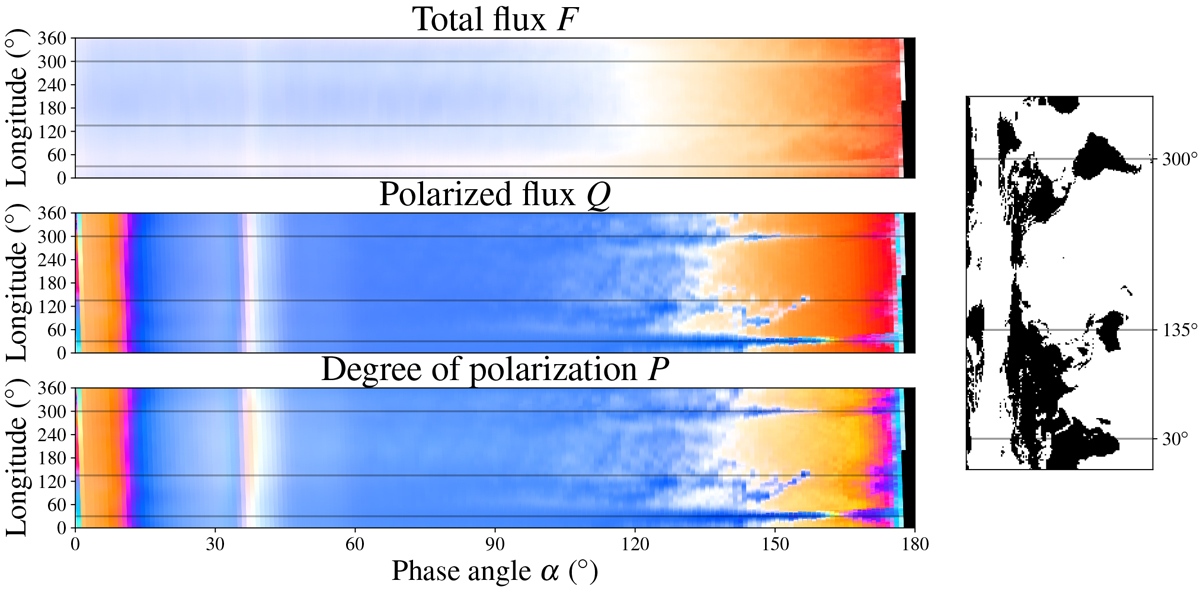
RGB colors of F (top), Q (middle), and P (bottom) of the cloudy model planet as functions of phase angle α and thelongitude in the middle of the longitude range that is visible to the observer (0° longitude corresponds with the Greenwich meridian). These color plots were constructed from the F, Q, and P phase curves at 443, 550 and 670 nm as presented in Fig. 4. The horizontal black lines indicate the respective longitudes on the geographical map on the right.
Current usage metrics show cumulative count of Article Views (full-text article views including HTML views, PDF and ePub downloads, according to the available data) and Abstracts Views on Vision4Press platform.
Data correspond to usage on the plateform after 2015. The current usage metrics is available 48-96 hours after online publication and is updated daily on week days.
Initial download of the metrics may take a while.