Fig. 3
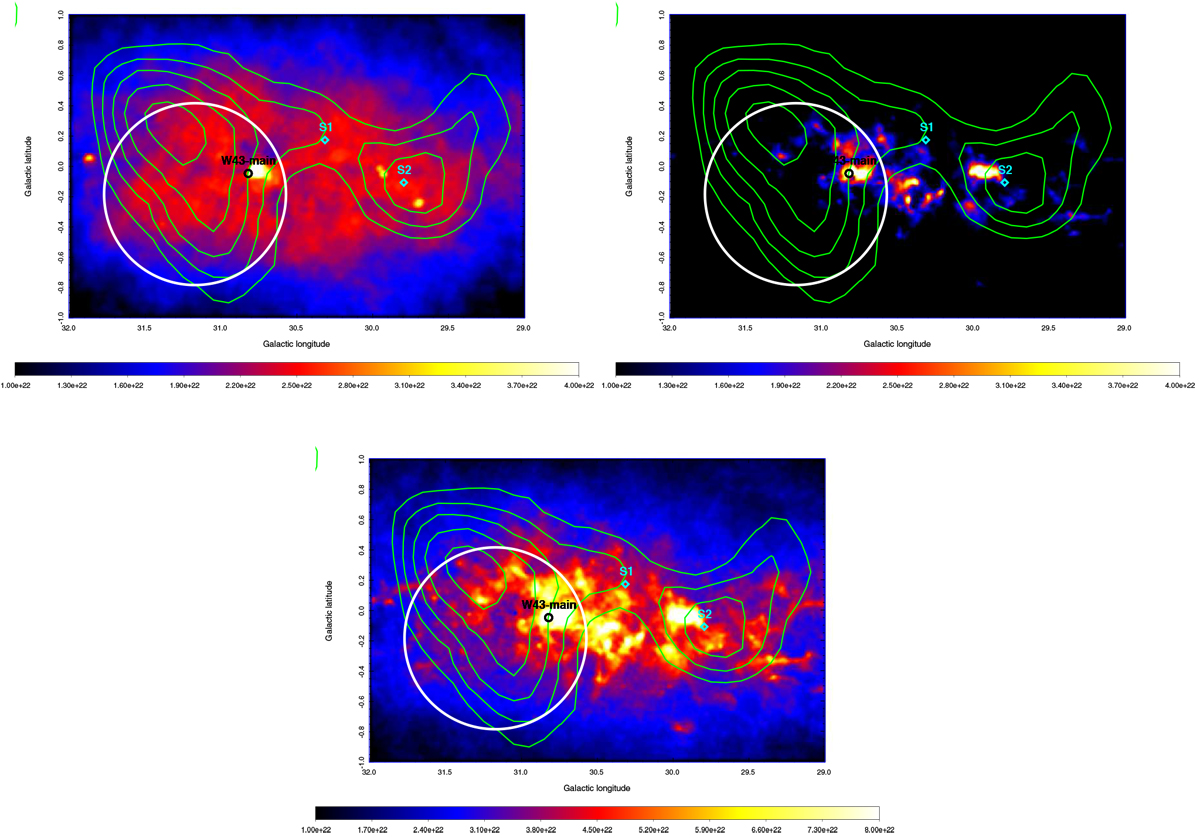
Maps of the H I (top-left), H2 (top-right), and total (bottom) gas columns. The labels are the same as in Fig. 1. The green contours represent the γ-ray emission, the contour levels are the counts per pixel of 0.5, 0.75, 1.0, 1.25, and 1.5 in the residual map above 10 GeV (Fig. 1). The color bars represent the gas column density in cm−2. For details, see the context in Sect. 3.
Current usage metrics show cumulative count of Article Views (full-text article views including HTML views, PDF and ePub downloads, according to the available data) and Abstracts Views on Vision4Press platform.
Data correspond to usage on the plateform after 2015. The current usage metrics is available 48-96 hours after online publication and is updated daily on week days.
Initial download of the metrics may take a while.