Fig. 2
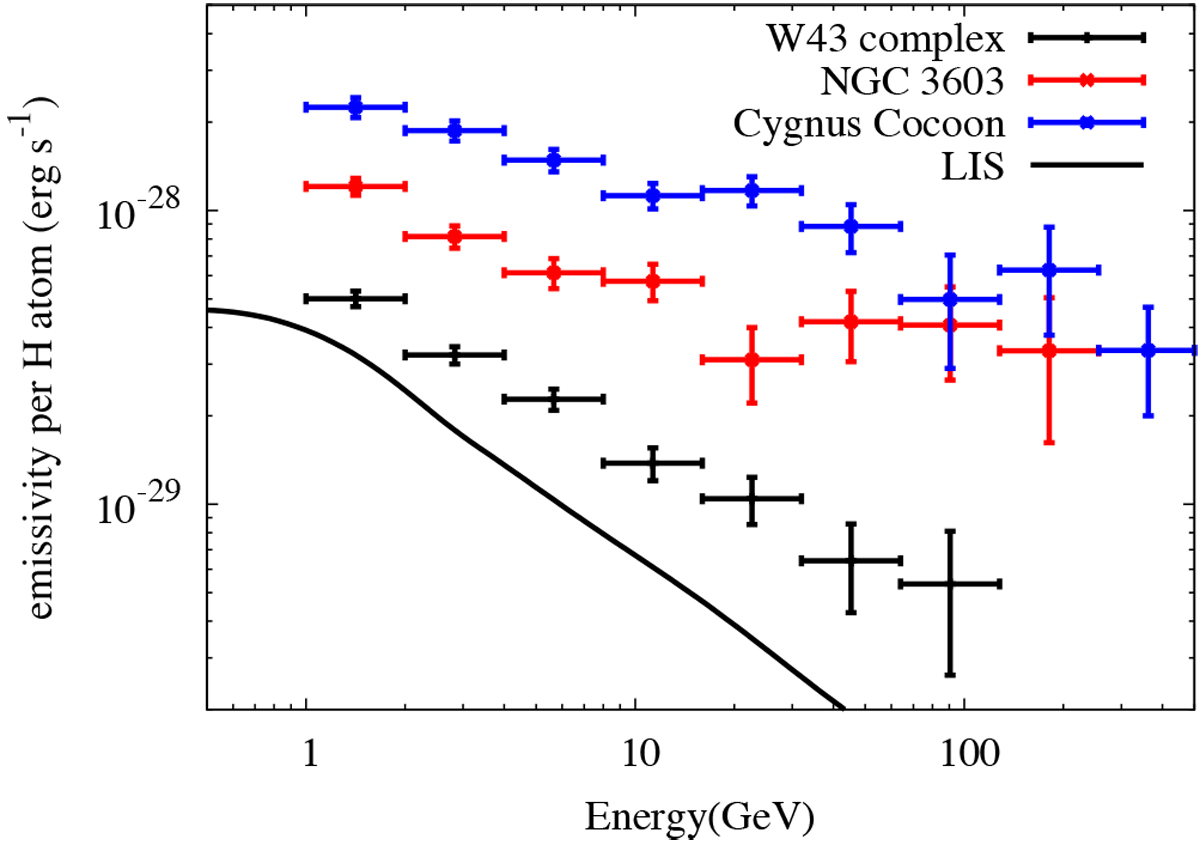
The SED of γ-ray emission toward W43 for a uniform disk spatial model with a radius of 0.6°, normalized to emissivity per H atom. The distance of 5.5 kpc is used and the masses are derived in Sect. 3. The solid curve represents the spectrum of emissivity per H atom, assuming the energy distribution of protons is the same as the local intestellar spectrum (LIS) (Casandjian 2015). Also plotted are the normalized SEDs of the Cygnus cocoon (Aharonian et al. 2019) and NGC 3603 (Yang & Aharonian 2017).
Current usage metrics show cumulative count of Article Views (full-text article views including HTML views, PDF and ePub downloads, according to the available data) and Abstracts Views on Vision4Press platform.
Data correspond to usage on the plateform after 2015. The current usage metrics is available 48-96 hours after online publication and is updated daily on week days.
Initial download of the metrics may take a while.