Fig. 8.
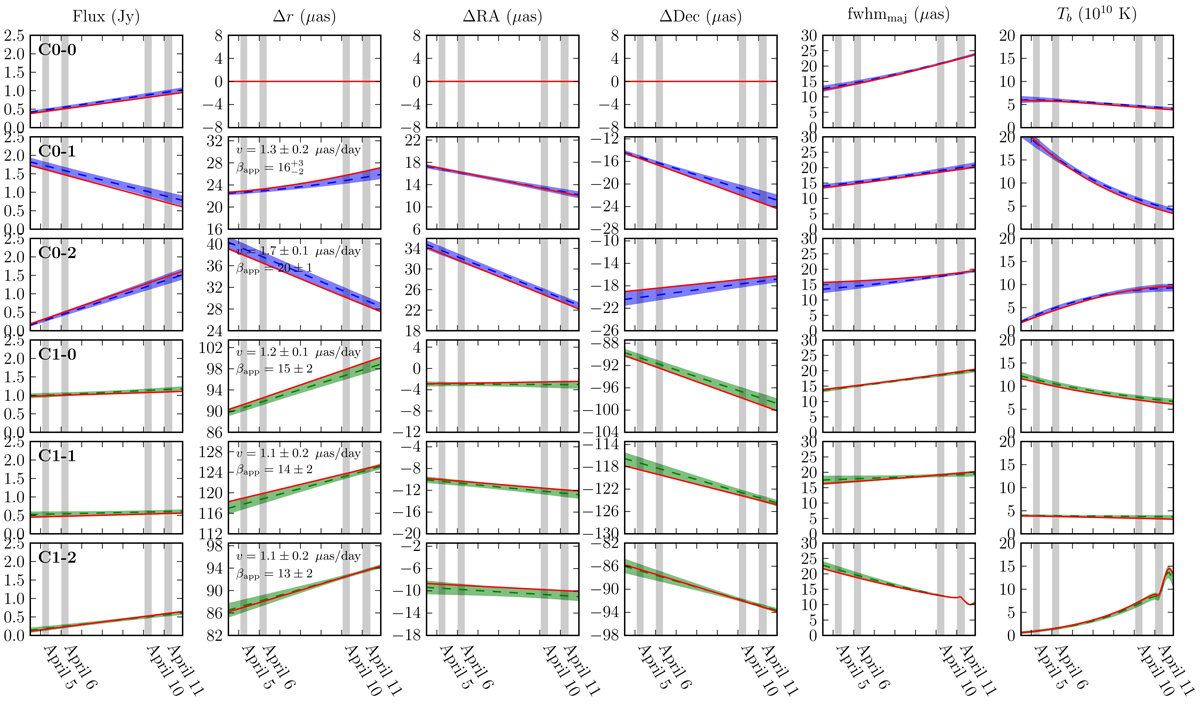
Model-fit parameters and their time evolution obtained by the THEMIS time-evolving model-fitting (Sect. 2.2). Each row shows a single component. Shaded regions indicate 95% confidence level at each time, the dashed line shows the median value, and the red solid lines indicate the best fit value. Observing epochs are shown by gray vertical bands. The component IDs are shown at the top left corner of the leftmost column. From left: flux density, radial distance with respect to C0-0, RA and Dec offsets with respect to C0-0, core mean FWHM sizes, and apparent brightness temperature.
Current usage metrics show cumulative count of Article Views (full-text article views including HTML views, PDF and ePub downloads, according to the available data) and Abstracts Views on Vision4Press platform.
Data correspond to usage on the plateform after 2015. The current usage metrics is available 48-96 hours after online publication and is updated daily on week days.
Initial download of the metrics may take a while.