Fig. 5.
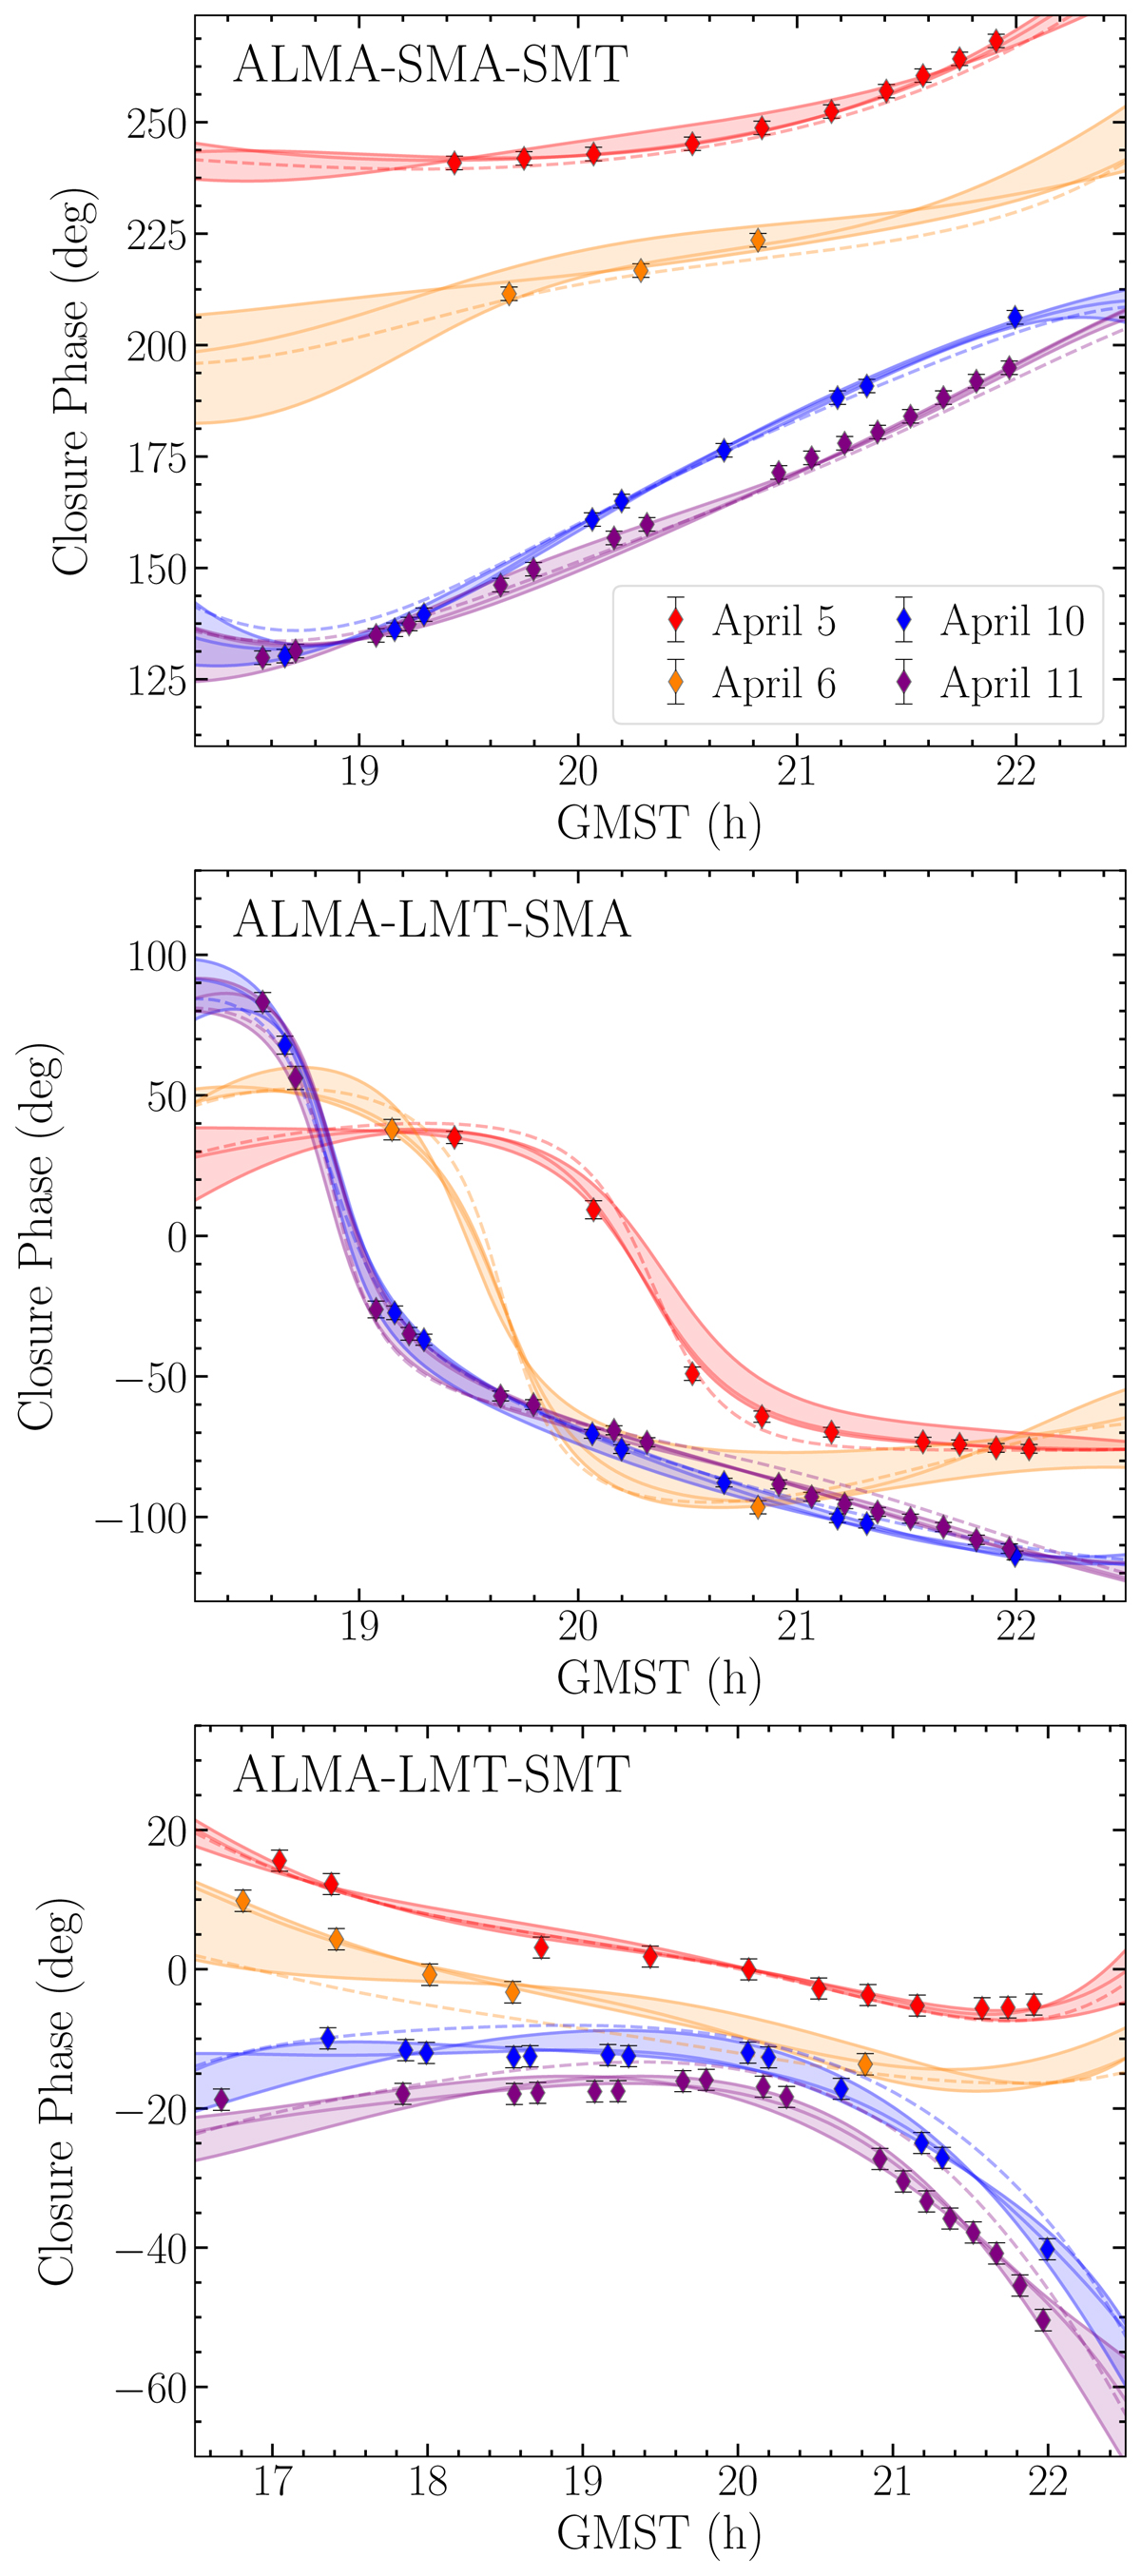
Example of the closure phase variation in 3C 279 over four epochs for the large ALMA-SMT-SMA, ALMA-LMT-SMA, and ALMA-LMT-SMT triangles. The points show the data, and their error bars include 1.5% systematic visibility errors (Paper III). The solid lines show the model closure phases corresponding to the images from each pipeline and day, and the dashed lines represent the model closure phases of the average images shown in Fig. 4. Regions constrained by predictions of the three independent image models are shaded.
Current usage metrics show cumulative count of Article Views (full-text article views including HTML views, PDF and ePub downloads, according to the available data) and Abstracts Views on Vision4Press platform.
Data correspond to usage on the plateform after 2015. The current usage metrics is available 48-96 hours after online publication and is updated daily on week days.
Initial download of the metrics may take a while.