Fig. D.1.
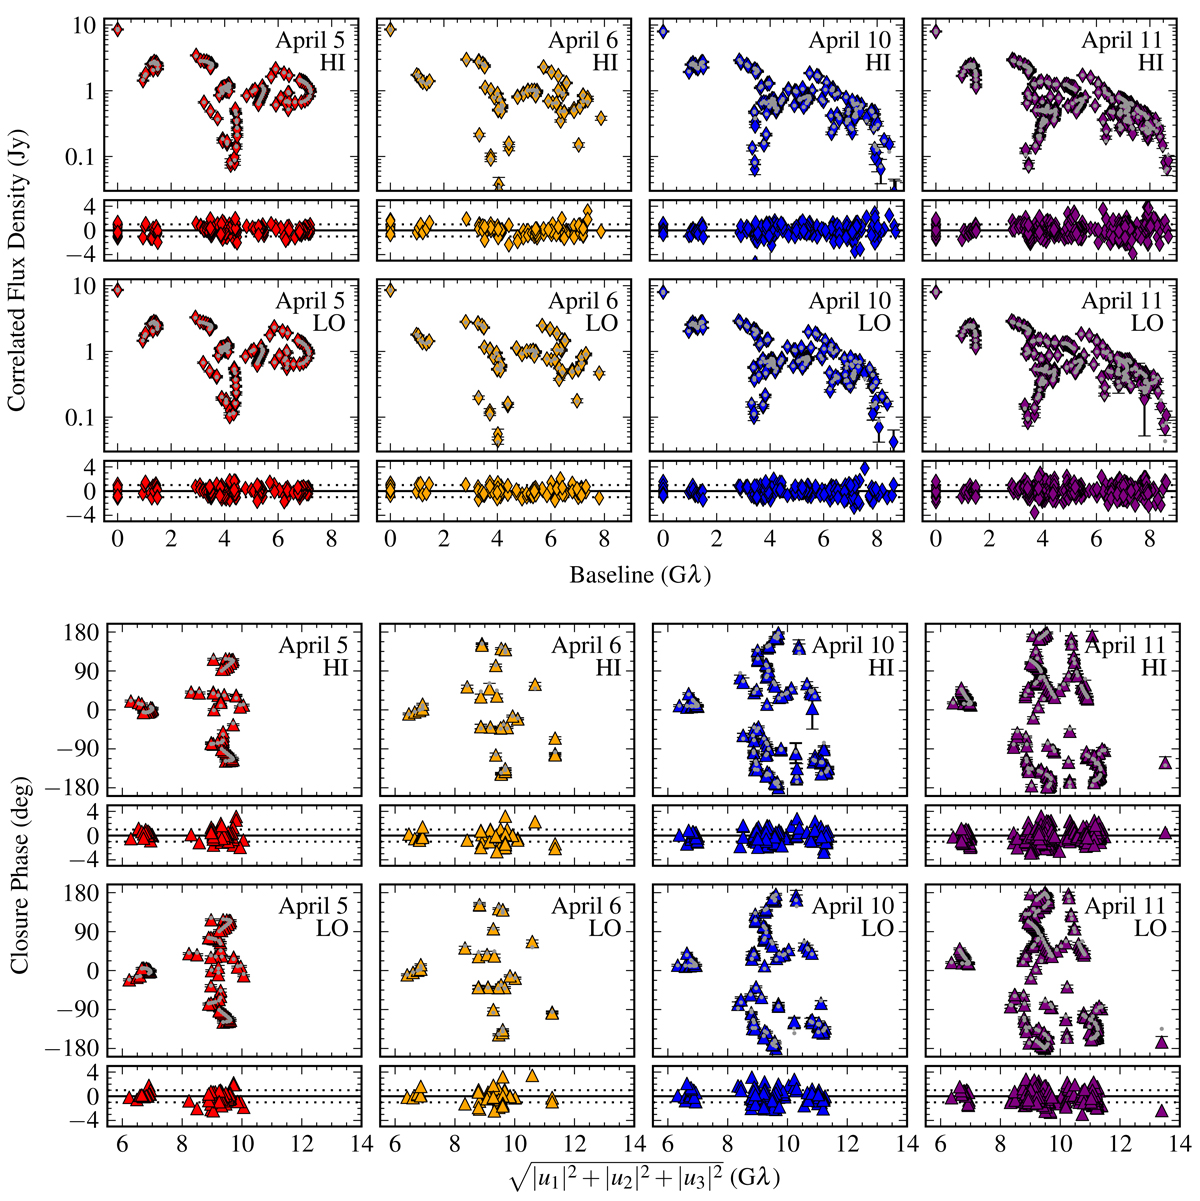
Visibility amplitudes (top) and closure phases (bottom) of the data (gray error bars) and Gaussian models (colored diamonds) for all epochs, for both observing frequency bands (HI and LO), and plotted against the baseline length and quadratic sum of the three baseline lengths in triangles (u1, u2, and u3), respectively. In both panels the bottom subpanels show residuals (i.e., differences between data and model) normalized by the uncertainties of each data point.
Current usage metrics show cumulative count of Article Views (full-text article views including HTML views, PDF and ePub downloads, according to the available data) and Abstracts Views on Vision4Press platform.
Data correspond to usage on the plateform after 2015. The current usage metrics is available 48-96 hours after online publication and is updated daily on week days.
Initial download of the metrics may take a while.