Open Access
Fig. 10.
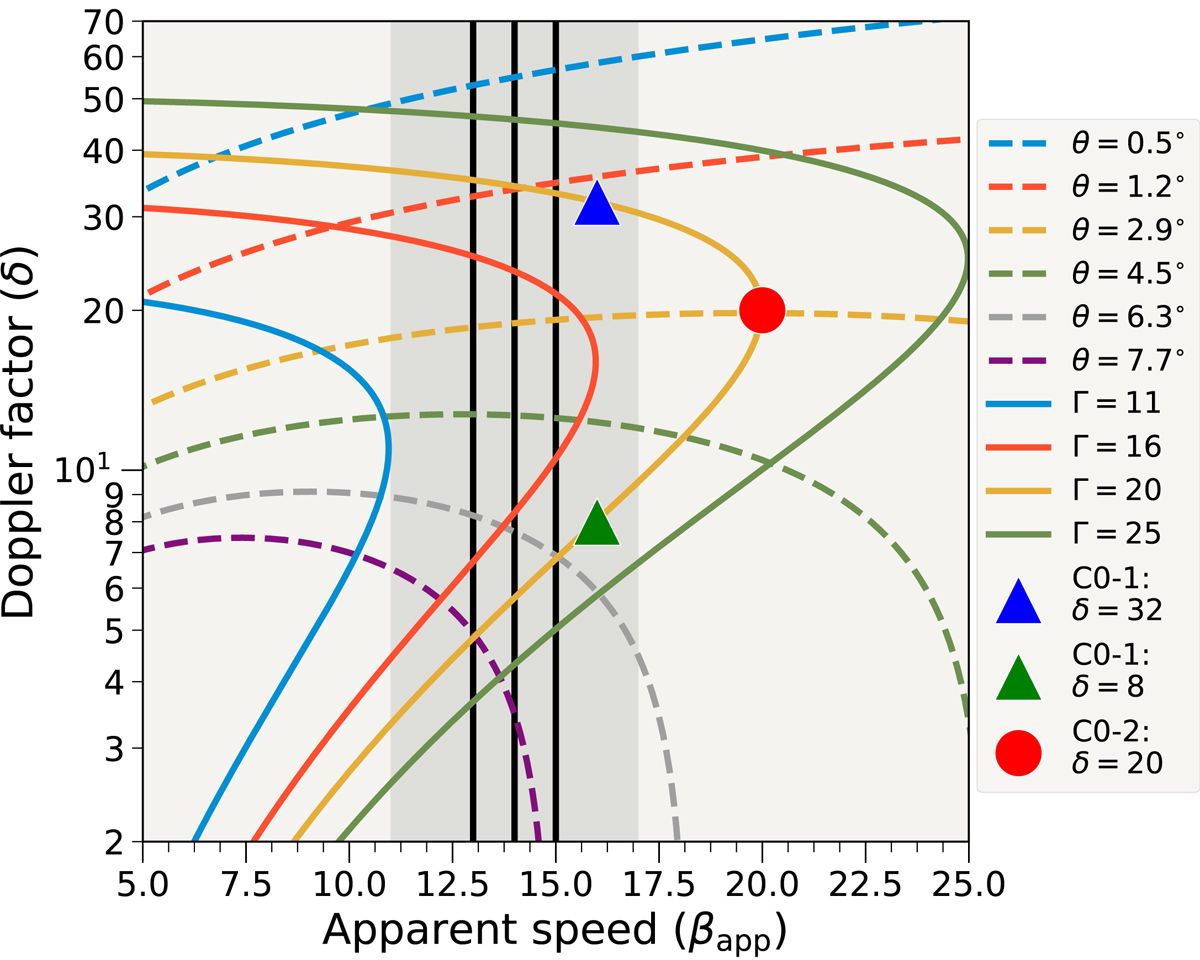
Same as Fig. 9, but for C1. The vertical solid black lines correspond to βapp values of the C1 subcomponents and the gray shaded area shows their uncertainties. For comparison, the model values for C0 components with Γ = 20 are also shown using the same symbols as in Fig. 9. The ranges of the axes are different from Fig. 9.
Current usage metrics show cumulative count of Article Views (full-text article views including HTML views, PDF and ePub downloads, according to the available data) and Abstracts Views on Vision4Press platform.
Data correspond to usage on the plateform after 2015. The current usage metrics is available 48-96 hours after online publication and is updated daily on week days.
Initial download of the metrics may take a while.