Open Access
Fig. 20.
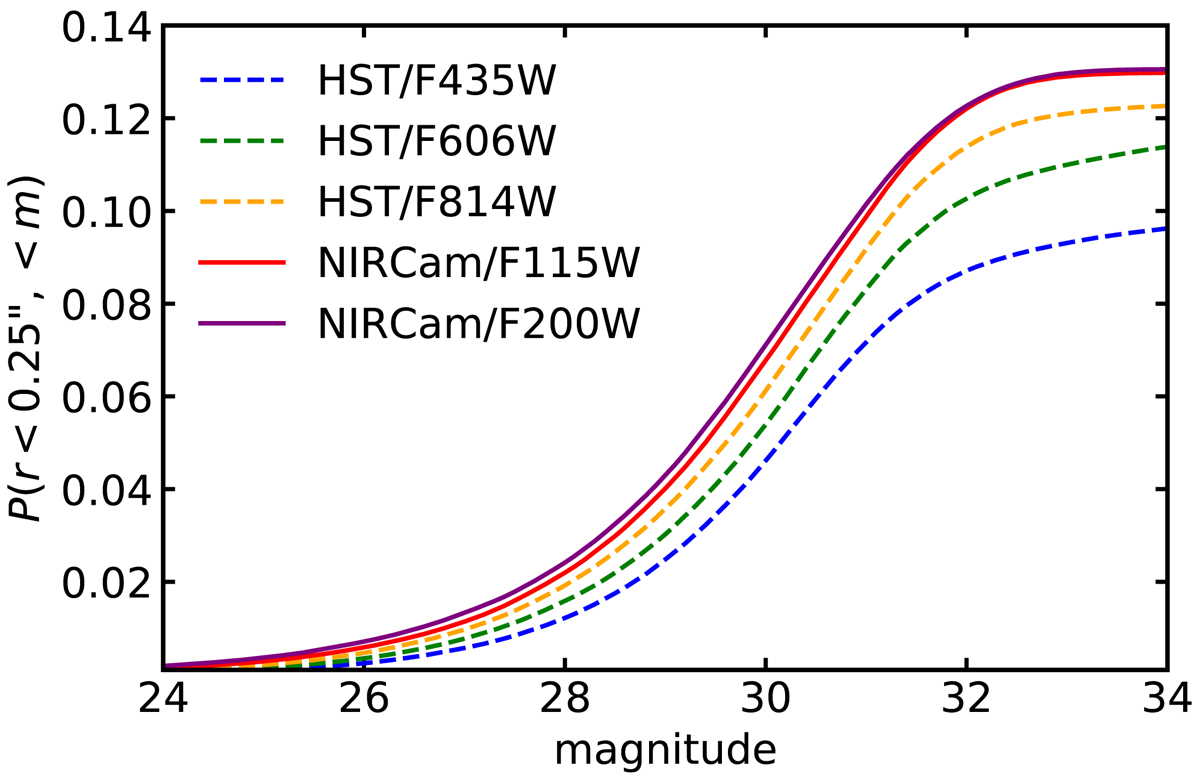
Probability of finding at least one brighter neighbor in the input catalog centered within a 0.25″ radius. The line styles and colors represent different bands.
Current usage metrics show cumulative count of Article Views (full-text article views including HTML views, PDF and ePub downloads, according to the available data) and Abstracts Views on Vision4Press platform.
Data correspond to usage on the plateform after 2015. The current usage metrics is available 48-96 hours after online publication and is updated daily on week days.
Initial download of the metrics may take a while.