Fig. A.1
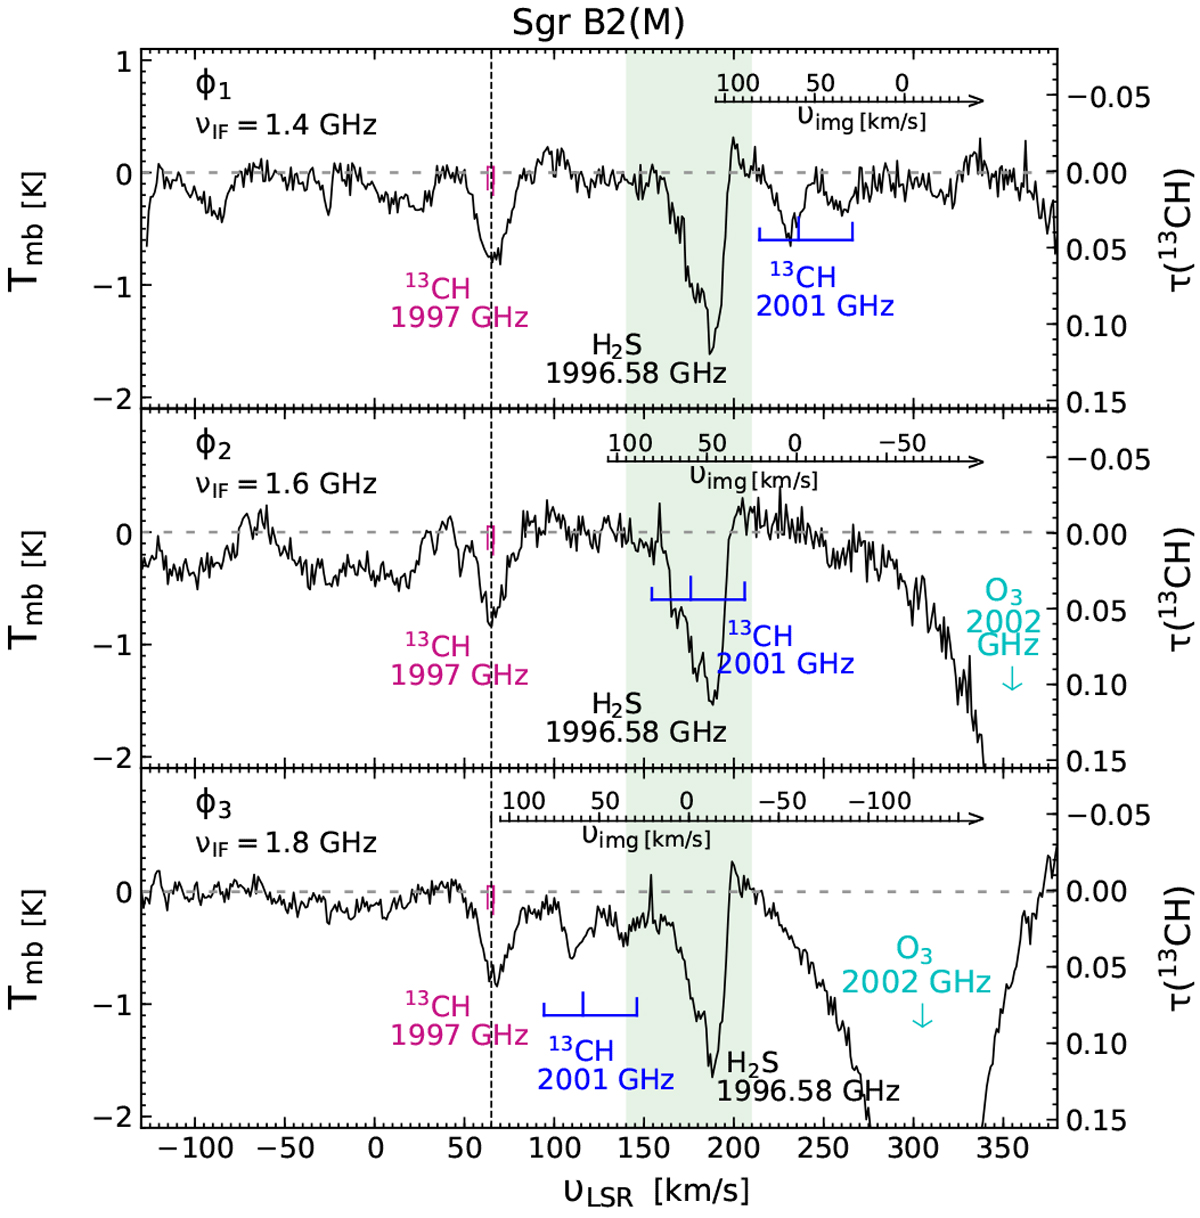
Calibrated and baseline-subtracted observed 13CH spectra at an IF setting of 1.4 GHz (top panel), 1.6 GHz (central panel), and 1.8 GHz (bottom panel) towards Sgr B2(M). The secondary y-axis in each panel presents the optical depth scale. Signal bandpass contamination, possibly from the
![]() transitions of H2S at 1996.589 GHz, is displayed by the green shaded region. The hyperfine transitions corresponding to the 1997 GHz
Λ-doublet arising from the signal band are displayed in pink, while that of the 2001 GHz
Λ-doublet arising from the image band is displayed in blue. The change in IF pushes both the second
Λ-doublet and the atmospheric ozone feature at 2002.347 GHz (telluric rest frame, marked in cyan) towards the signal band features. The secondary x-axis in each panel represents the image band LSR velocity scale.
transitions of H2S at 1996.589 GHz, is displayed by the green shaded region. The hyperfine transitions corresponding to the 1997 GHz
Λ-doublet arising from the signal band are displayed in pink, while that of the 2001 GHz
Λ-doublet arising from the image band is displayed in blue. The change in IF pushes both the second
Λ-doublet and the atmospheric ozone feature at 2002.347 GHz (telluric rest frame, marked in cyan) towards the signal band features. The secondary x-axis in each panel represents the image band LSR velocity scale.
Current usage metrics show cumulative count of Article Views (full-text article views including HTML views, PDF and ePub downloads, according to the available data) and Abstracts Views on Vision4Press platform.
Data correspond to usage on the plateform after 2015. The current usage metrics is available 48-96 hours after online publication and is updated daily on week days.
Initial download of the metrics may take a while.