Fig. 4
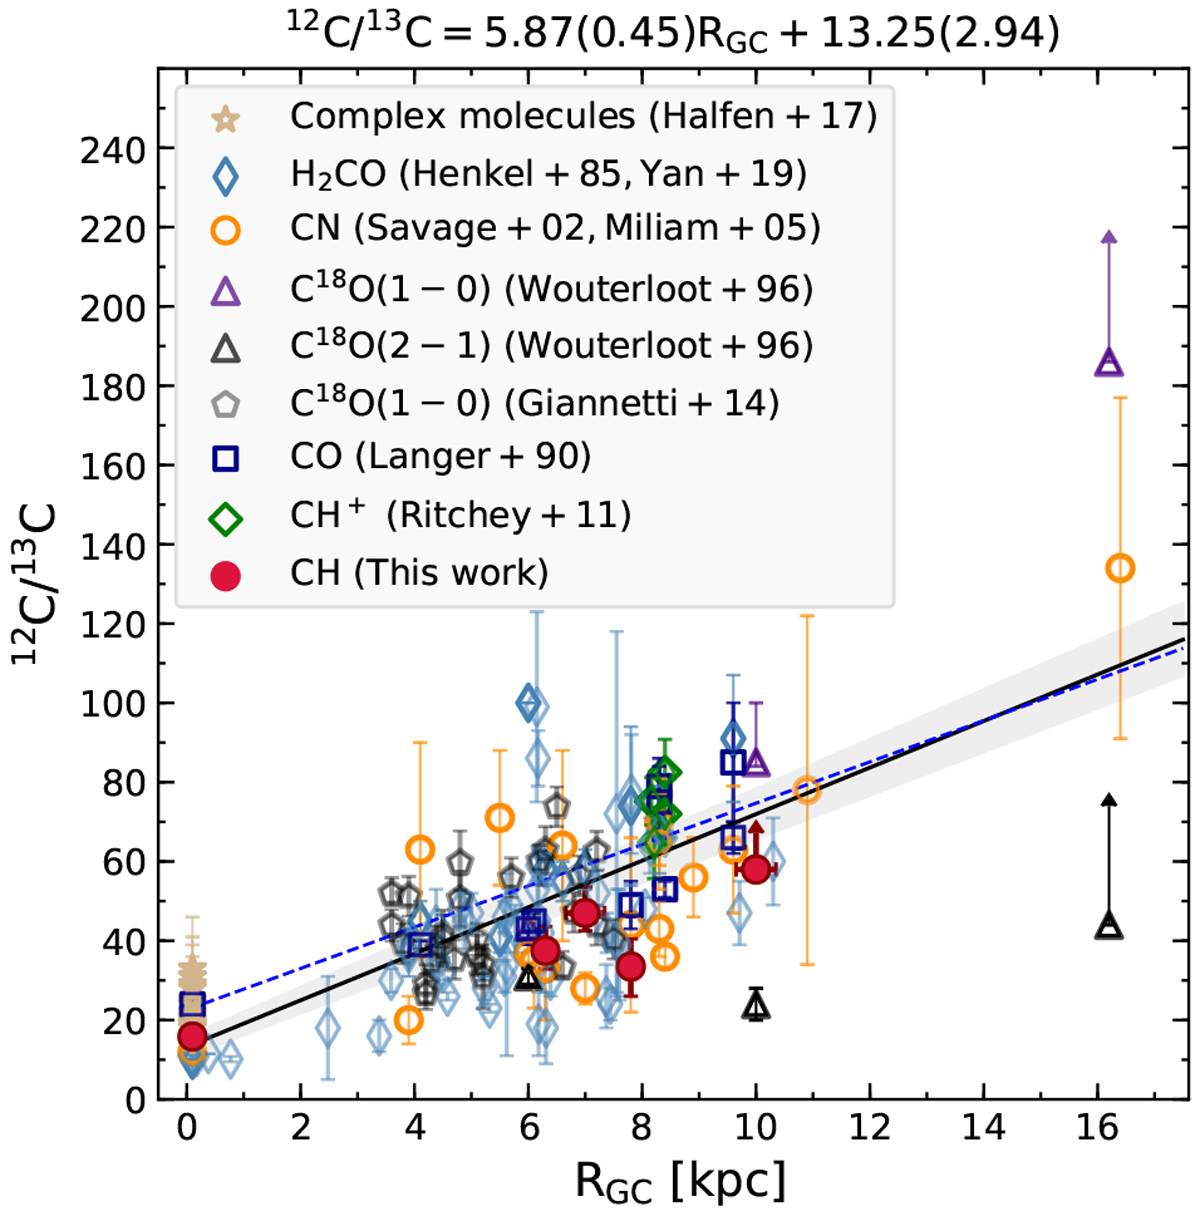
Plot of 12C/13C isotope ratios as a function of galactocentric distance, RGC (kpc). The filled red circles represent the 12C/13C ratio obtained using CH (this paper), while the empty black and purple triangles, grey pentagons, yellow circles, dark blue squares, and green, light blue diamonds and tan stars are those obtained using isotopologues of C18O (J = 1− 0 and J = 2−1 transitions) (Wouterloot & Brand 1996; Giannetti et al. 2014), CN (Savage et al. 2002; Milam et al. 2005), CO (Langer & Penzias 1990), CH+ (Ritchey et al. 2011), H2CO (Henkel et al. 1985; Yan et al. 2019), and complex organic molecules (Halfen et al. 2017), respectively. The black solid line represents the weighted fit to the data, and the grey shaded region demarcates the 1σ interval of this fit. For comparison, the fit obtained by Halfen et al. (2017) is displayed by the dashed blue line.
Current usage metrics show cumulative count of Article Views (full-text article views including HTML views, PDF and ePub downloads, according to the available data) and Abstracts Views on Vision4Press platform.
Data correspond to usage on the plateform after 2015. The current usage metrics is available 48-96 hours after online publication and is updated daily on week days.
Initial download of the metrics may take a while.