Fig. 6.
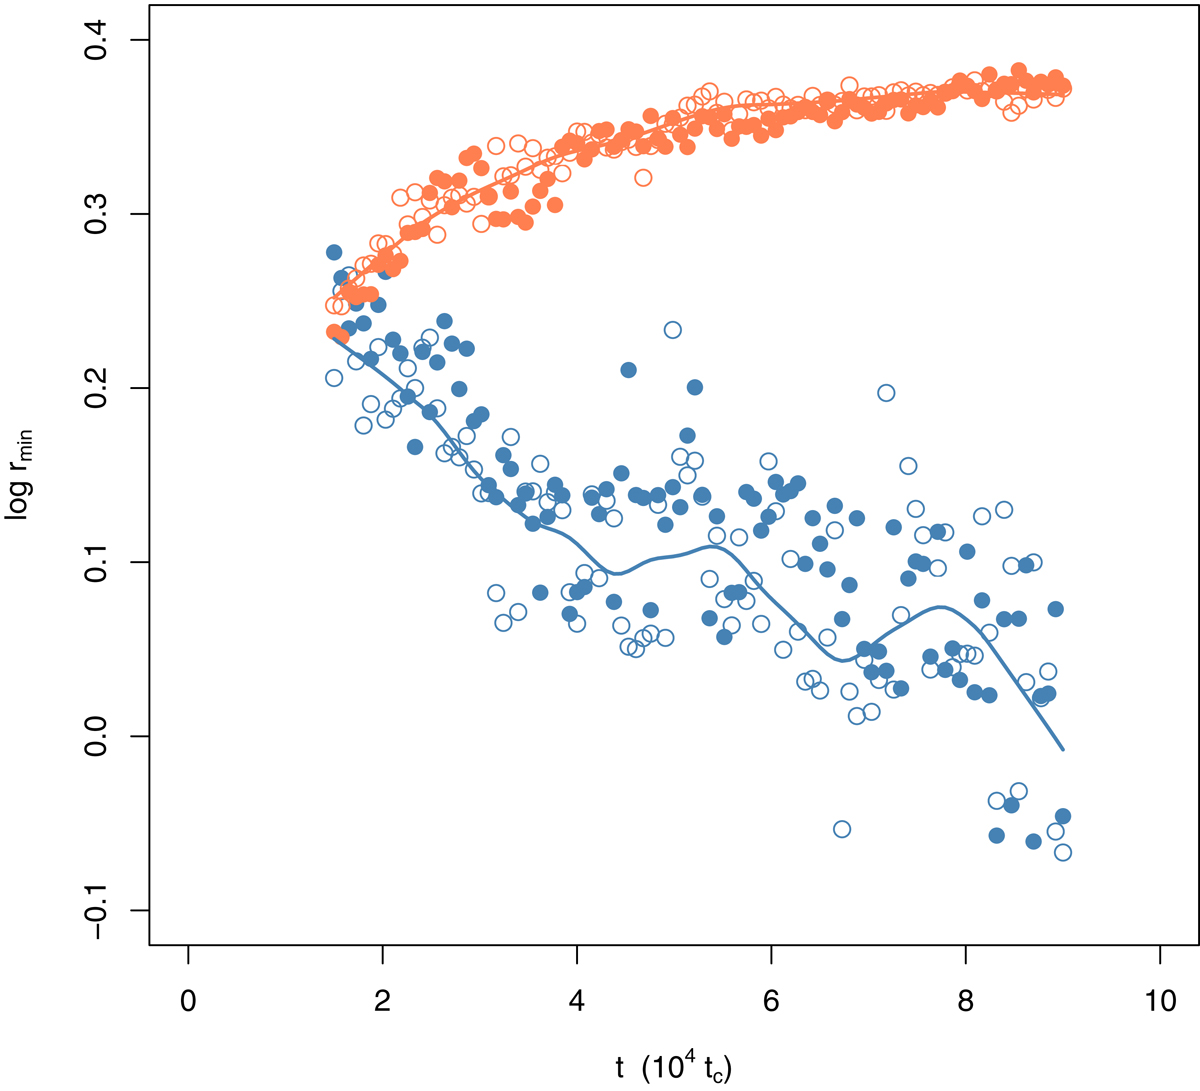
Time evolution of the log radial position of the zone of avoidance for a population of BSS with masses mBSS = 1.5m* (empty circles) and mBSS = 2m* (filled circles), initially placed on purely radial orbits. Time is measured in units of 104 dynamical crossing times. The orange circles refer to models employing a Holtsmark distribution of force fluctuations, while the blue circles refer to models where a three-dimensional Gaussian distribution of fluctuations was used. Plotted to guide the eye are a local polynomial regression (solid lines) fitted to the mBSS = 2m* zone of avoidance position for Holtsmark (orange) and Gaussian (blue) force kicks. Radial and circular orbits (see Fig. 5) are two extreme cases considered to show that the results are robust to changes in the distribution of BSS orbital angular momenta.
Current usage metrics show cumulative count of Article Views (full-text article views including HTML views, PDF and ePub downloads, according to the available data) and Abstracts Views on Vision4Press platform.
Data correspond to usage on the plateform after 2015. The current usage metrics is available 48-96 hours after online publication and is updated daily on week days.
Initial download of the metrics may take a while.