Fig. 7.
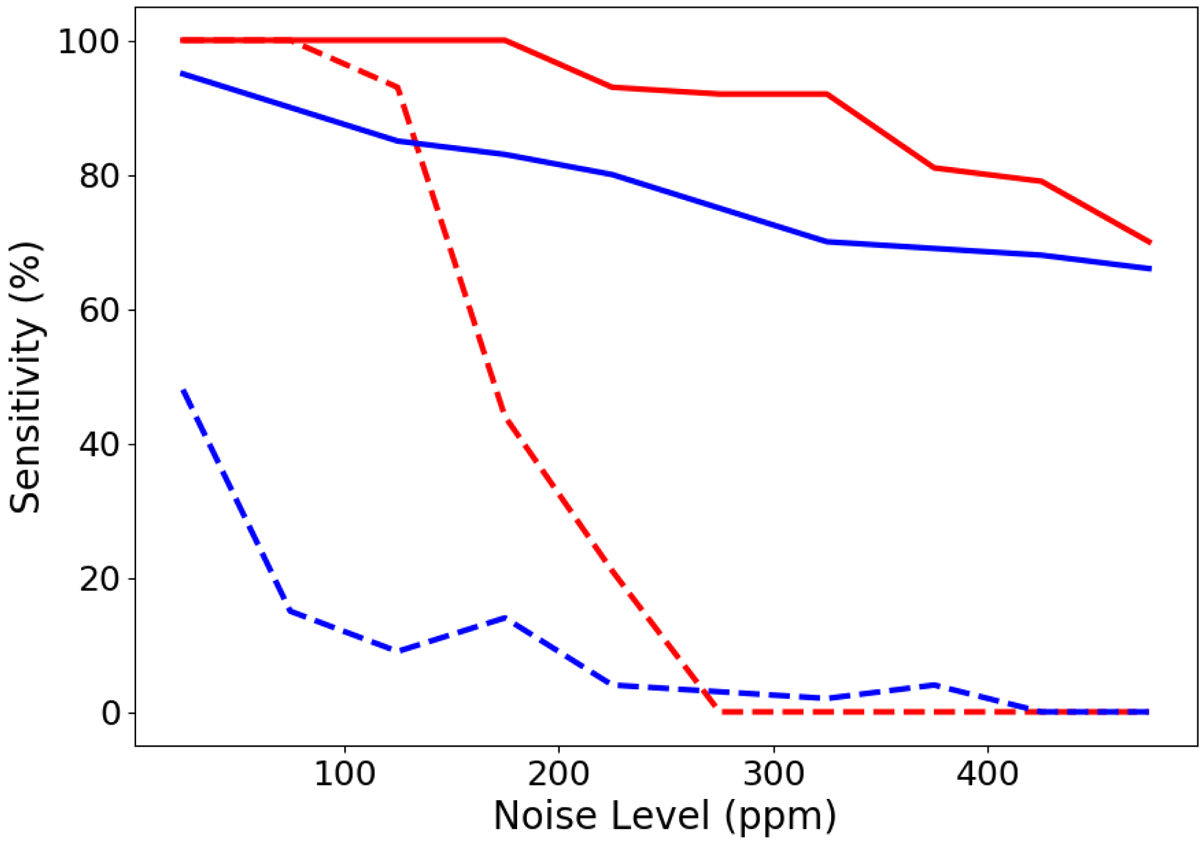
Sensitivity as a function of noise level using input data generated with 3 free parameters (exomoon radii, exomoon orbital phases, and noise levels, see Table 2; red curves) and with 14 free parameters (see Table 7; blue curves). The two methods are compared at a fixed exomoon radius of 1 R⊕: ConvNet (solid curves) vs. ΔBIC (dashed curves). The sensitivity is plotted in bins of 50 ppm noise levels.
Current usage metrics show cumulative count of Article Views (full-text article views including HTML views, PDF and ePub downloads, according to the available data) and Abstracts Views on Vision4Press platform.
Data correspond to usage on the plateform after 2015. The current usage metrics is available 48-96 hours after online publication and is updated daily on week days.
Initial download of the metrics may take a while.