Fig. 2.
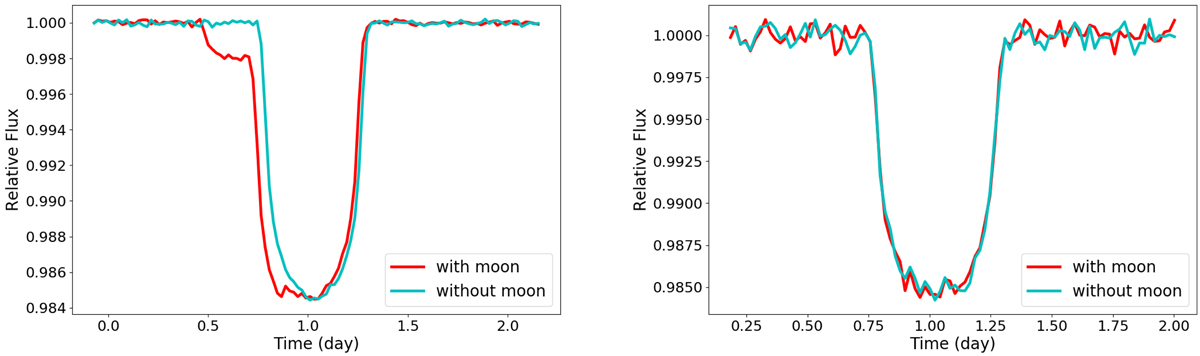
Examples of simulated transit light curves. Left panel: the curve shows a transit of a planet with radius Rp = 12 R⊕ (similar to that of Kepler 1625b) for a low level of noise (100 ppm). The red curve shows a similar but different planetary transit, and an exomoon transit is superimposed (Rm = 4.75 R⊕). Right panel: simulations for a higher noise level (400 ppm) and a much smaller moon Rm = R⊕. The distinction between the planet-only (blue) and planet-moon (red) case is not visible by eye in most cases.
Current usage metrics show cumulative count of Article Views (full-text article views including HTML views, PDF and ePub downloads, according to the available data) and Abstracts Views on Vision4Press platform.
Data correspond to usage on the plateform after 2015. The current usage metrics is available 48-96 hours after online publication and is updated daily on week days.
Initial download of the metrics may take a while.