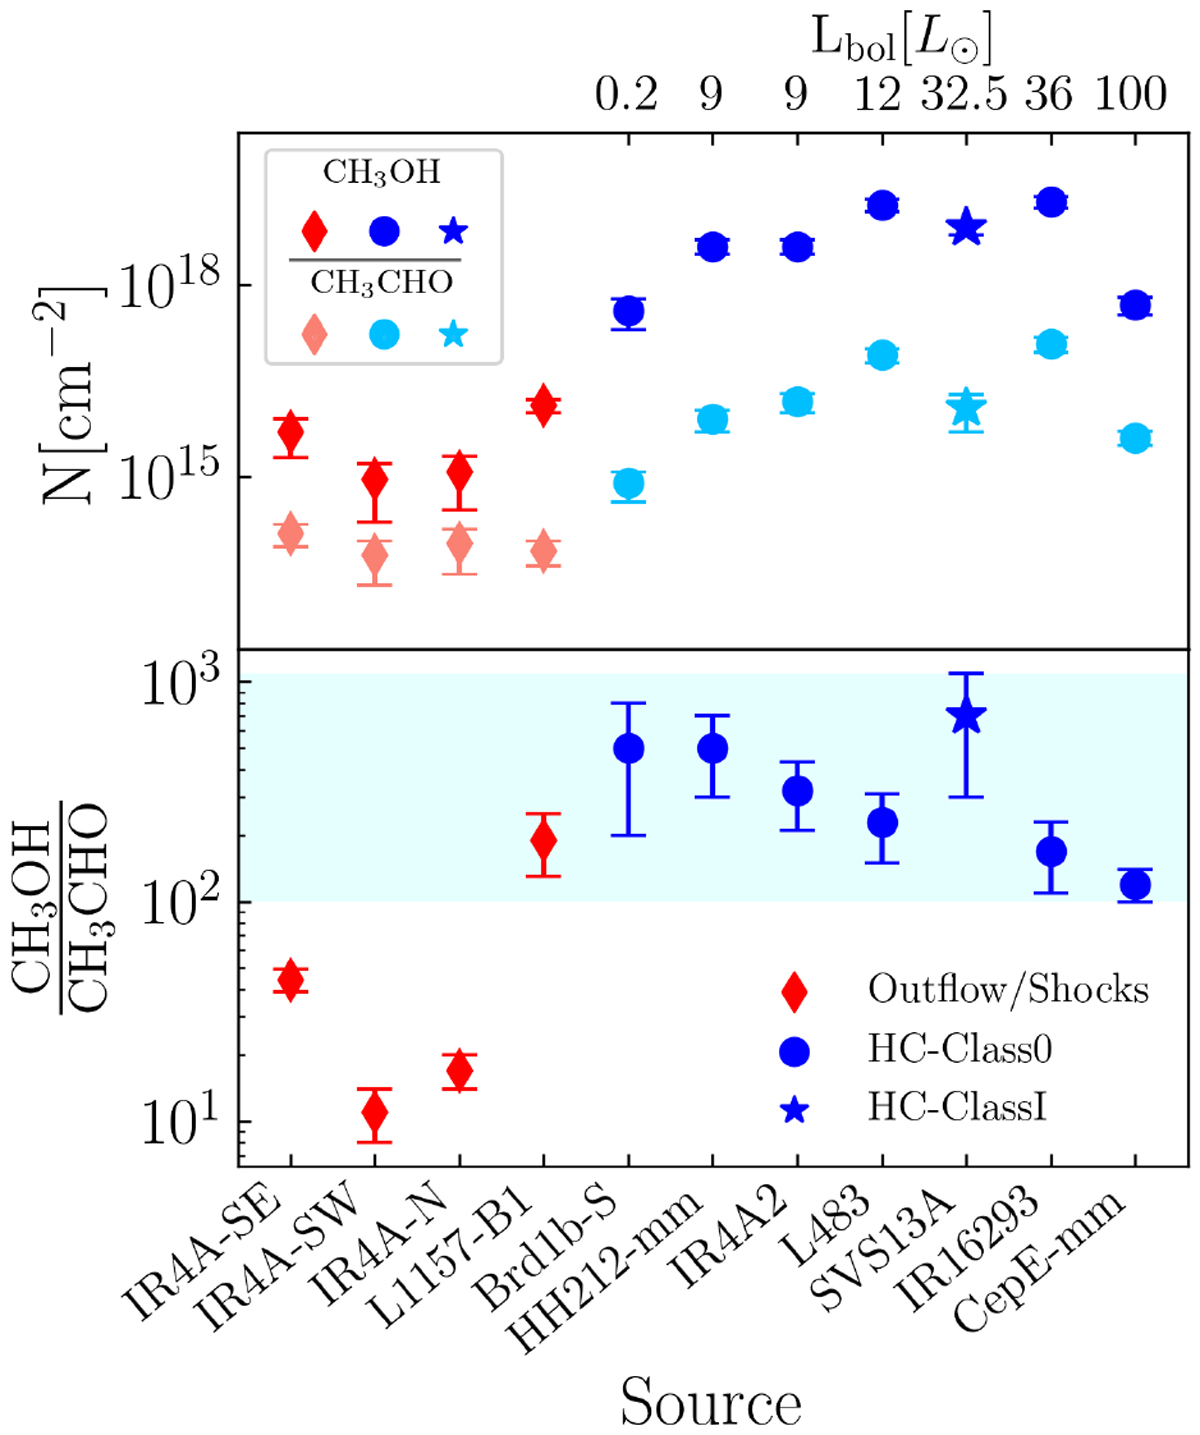
Fig. 7

Abundance ratios of CH3OH to CH3 CHO (bottom panel) and the CH3OH and CH3CHO column density (upper panel) compared to different sources whose emitting size has been estimated via interferometric observations: the values in the outflows of IRAS 4A (this paper), in the outflow of L1157-B1 (Codella et al. 2020), the Class I source SVS 13A (Bianchi et al. 2019), and the Class 0 sources, in decreasing order of bolometric luminosity: Barnard1b-S (Marcelino et al. 2018), HH212-mm (Bianchi et al. 2017; Codella et al. 2020), IRAS 4A2 (Taquet et al. 2015; López-Sepulcre et al. 2017), L483 (Jacobsen et al. 2019), IRAS 16293-2422B (Jørgensen et al. 2016), CepE-mm (Ospina-Zamudio et al. 2018). The outflow values are shown in red (pink for CH3 CHO), the hot corinos in blue (cyan for CH3CHO), using diamonds for the outflows, dots for Class 0 sources, and stars for the Class I sources. The cyan band represents the area in which the hot corino values fall.
Current usage metrics show cumulative count of Article Views (full-text article views including HTML views, PDF and ePub downloads, according to the available data) and Abstracts Views on Vision4Press platform.
Data correspond to usage on the plateform after 2015. The current usage metrics is available 48-96 hours after online publication and is updated daily on week days.
Initial download of the metrics may take a while.


