Fig. 5

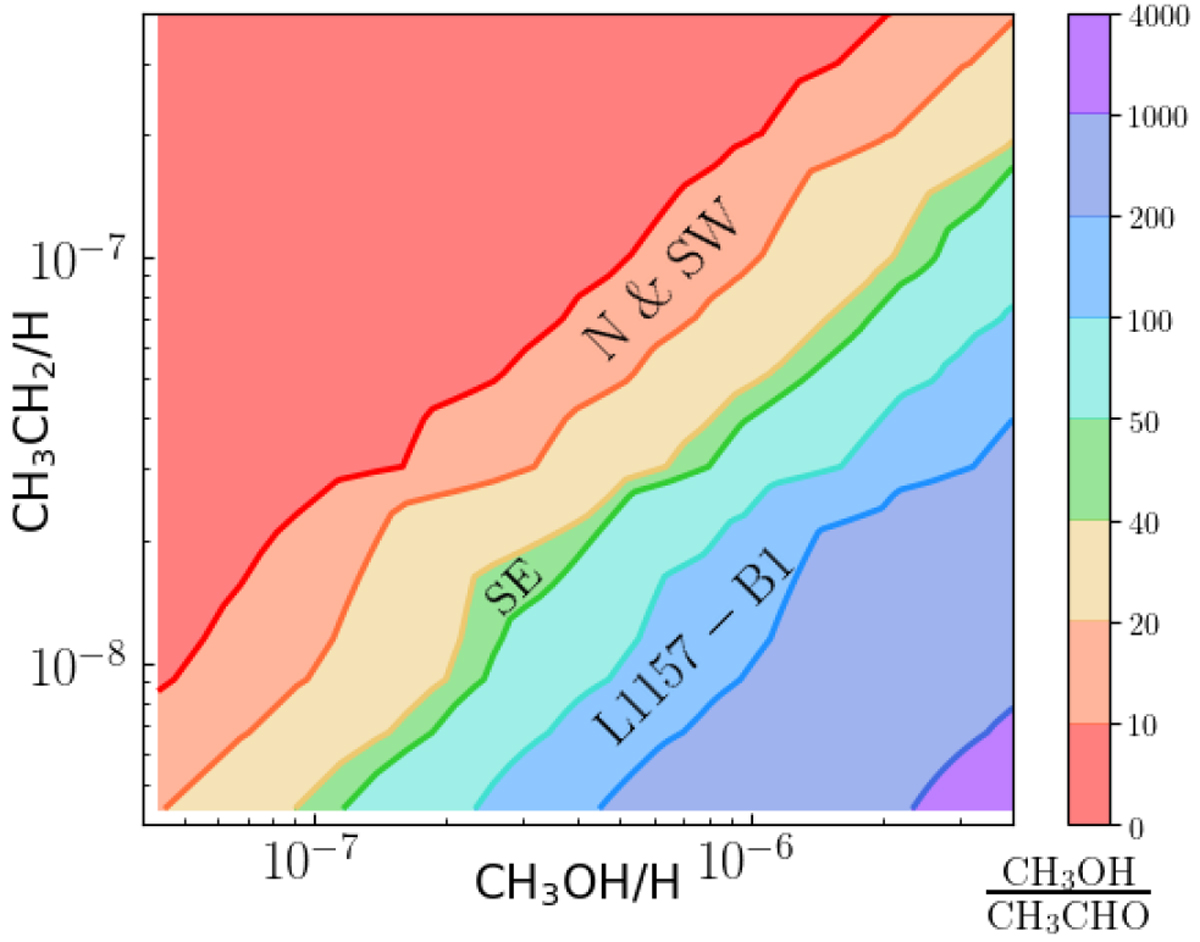
Contour map of the CH3OH/CH3CHO abundance ratio at 1000 yr after the start of the shock passage. The x- and y-axis are the injected abundances of methanol [4 × 10⁻⁸, 4 × 10⁻⁶] and the parent molecule of acetaldehyde, ethyl radical CH3CH2 [4 × 10⁻⁹, 4 × 10⁻⁷], respectively. The measured methanol to acetaldehyde abundance ratio of the North and SW outflows (8−20) fall in the orange band, and that of SE (38−50) in the green band; the L1157-B1 value (130−250) is covered by the blue band (Codella et al. 2020).
Current usage metrics show cumulative count of Article Views (full-text article views including HTML views, PDF and ePub downloads, according to the available data) and Abstracts Views on Vision4Press platform.
Data correspond to usage on the plateform after 2015. The current usage metrics is available 48-96 hours after online publication and is updated daily on week days.
Initial download of the metrics may take a while.


