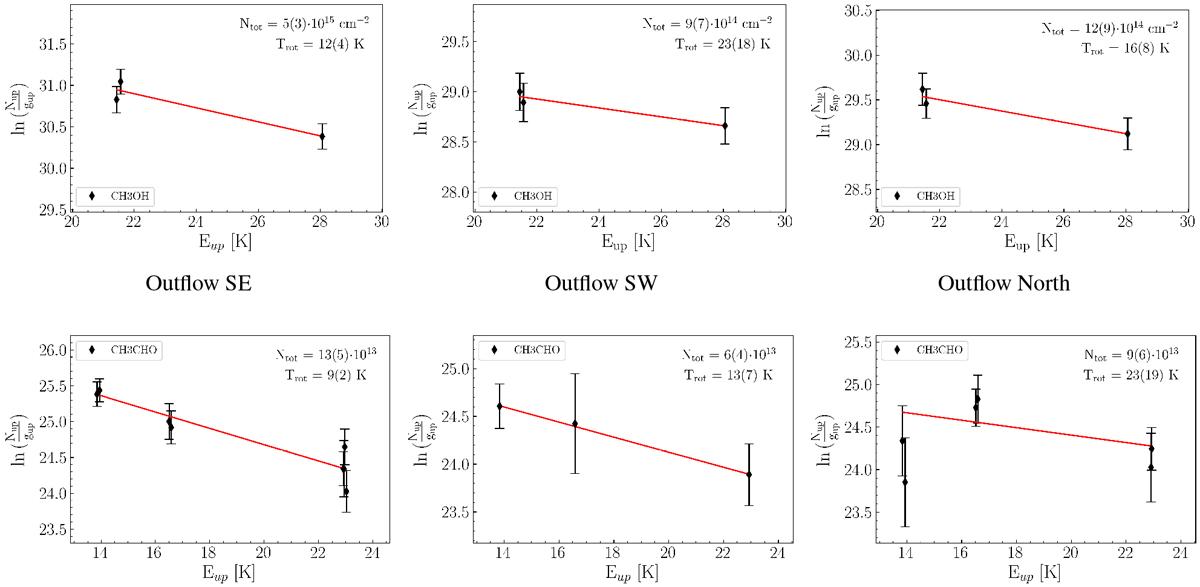
Fig. 4

Upper panels: rotational diagrams of methanol (CH3OH) in outflow SE, SW, and North (from left to right). Lower panels: rotational diagrams of acetaldehyde (CH3 CHO) in outflow SE, SW, and North. The parameters Nup, gup, and Eup are the column density, the degeneracy, and the energy of the upper level. The error bars on ln (Nup ∕gup) are computed by taking the calibration error on the integrated flux (15%) into account. The red lines represent the best fits.
Current usage metrics show cumulative count of Article Views (full-text article views including HTML views, PDF and ePub downloads, according to the available data) and Abstracts Views on Vision4Press platform.
Data correspond to usage on the plateform after 2015. The current usage metrics is available 48-96 hours after online publication and is updated daily on week days.
Initial download of the metrics may take a while.


