Fig. 2
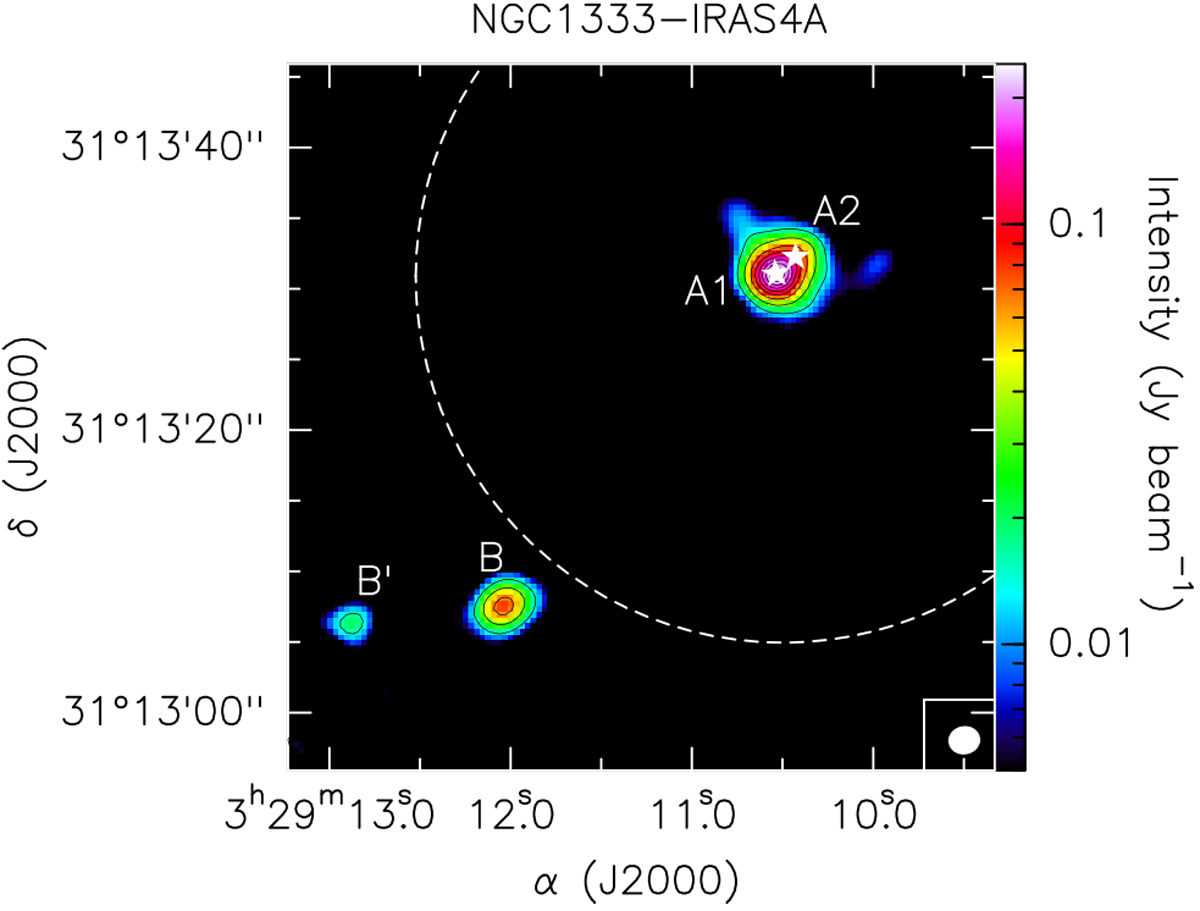
Dust continuum emission maps of IRAS 4A at 95.85–99.45 GHz (Setup 3, see Table 1). Contours start at 3σ and increase by steps of 20σ, with σ = 1.5 mJy beam−1. The synthesized beam (~2″) is represented in white in the lower right corner of the panel, the primary beam (~ 52″) is shown with a dashed white circle. The millimeter continuum sources in the field are labeled following the nomenclature used by Choi (2001) for 4A1 and 4A2 and Di Francesco et al. (2001) for B and B′.
Current usage metrics show cumulative count of Article Views (full-text article views including HTML views, PDF and ePub downloads, according to the available data) and Abstracts Views on Vision4Press platform.
Data correspond to usage on the plateform after 2015. The current usage metrics is available 48-96 hours after online publication and is updated daily on week days.
Initial download of the metrics may take a while.