Fig. 1

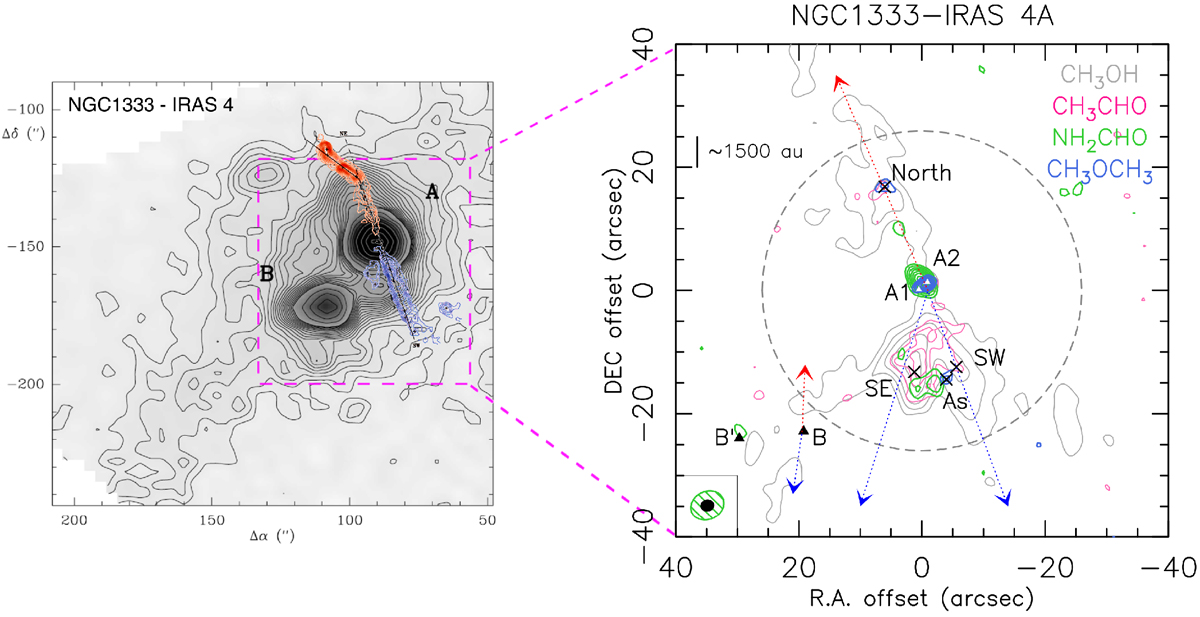
Left: overlap of the contour map of the 1.25 mm continuum emission from NGC 1333 IRAS 4 region in Perseus, observed with the IRAM 30 m antenna (Lefloch et al. 1998), with the map of SiO line (VLA observations; Choi 2005). Axes offsets are in arcseconds from SVS 13 (α(2000) = 03h29m3.s9 and δ(2000) = 31°16′8″). Right: zoomed-in image of the IRAS 4A system with NOEMA-SOLIS observations. Axes offsets are in arcseconds from IRAS 4A. A spatial separation of 5″ correspond to ~1500 au at a distance of 299 pc (Zucker et al. 2018). The white triangles give the position of the sources 4A1 and 4A2, while the black triangles give the position of the sources 4B and 4B′ (coordinates in Table 2). The black crosses give the analyzed positions in the outflows (SE, SW, North, and As; coordinates in Table 2). The dashed blue and red arrows indicate the direction of the blue- and red-shifted 4B outflow (from the HCN observations of Choi 2001) and of the 4A outflow. The contour map represents the iCOMs emission at 3 mm in the IRAS 4A outflows (this work). For all the iCOMs the contours start at 3σ with steps of1σ, except for methanol whose contours have steps of 20σ. The emission distribution is the following: 1) methanol (CH3OH in gray), integrated over the transitions 20,2 − 10,1 A, 20,2 −10,1 E, and 2−1,2 − 1−1,1 E with σ= 75 mJy beam−1 km s−1 ; 2) acetaldehyde (CH3CHO, in magenta),here in the 50,5 − 40,4 A emission with σ = 11 mJy beam−1 km s−1 ; 3) formamide (NH2CHO, in green), 41,4 − 31,3 emission with σ = 10 mJy beam−1 km s−1 ; dimethyl ether (CH3OCH3, in blue), 41,4 − 30,3 emission with σ = 9 mJy beam−1 km s−1. The synthesized beams for the formamide line (green, ~4″) and for the other species (black, ~2″) are indicated in the lower left corner. The primary beam (~52″) is shown as a dashed gray circle.
Current usage metrics show cumulative count of Article Views (full-text article views including HTML views, PDF and ePub downloads, according to the available data) and Abstracts Views on Vision4Press platform.
Data correspond to usage on the plateform after 2015. The current usage metrics is available 48-96 hours after online publication and is updated daily on week days.
Initial download of the metrics may take a while.


