Fig. 7.
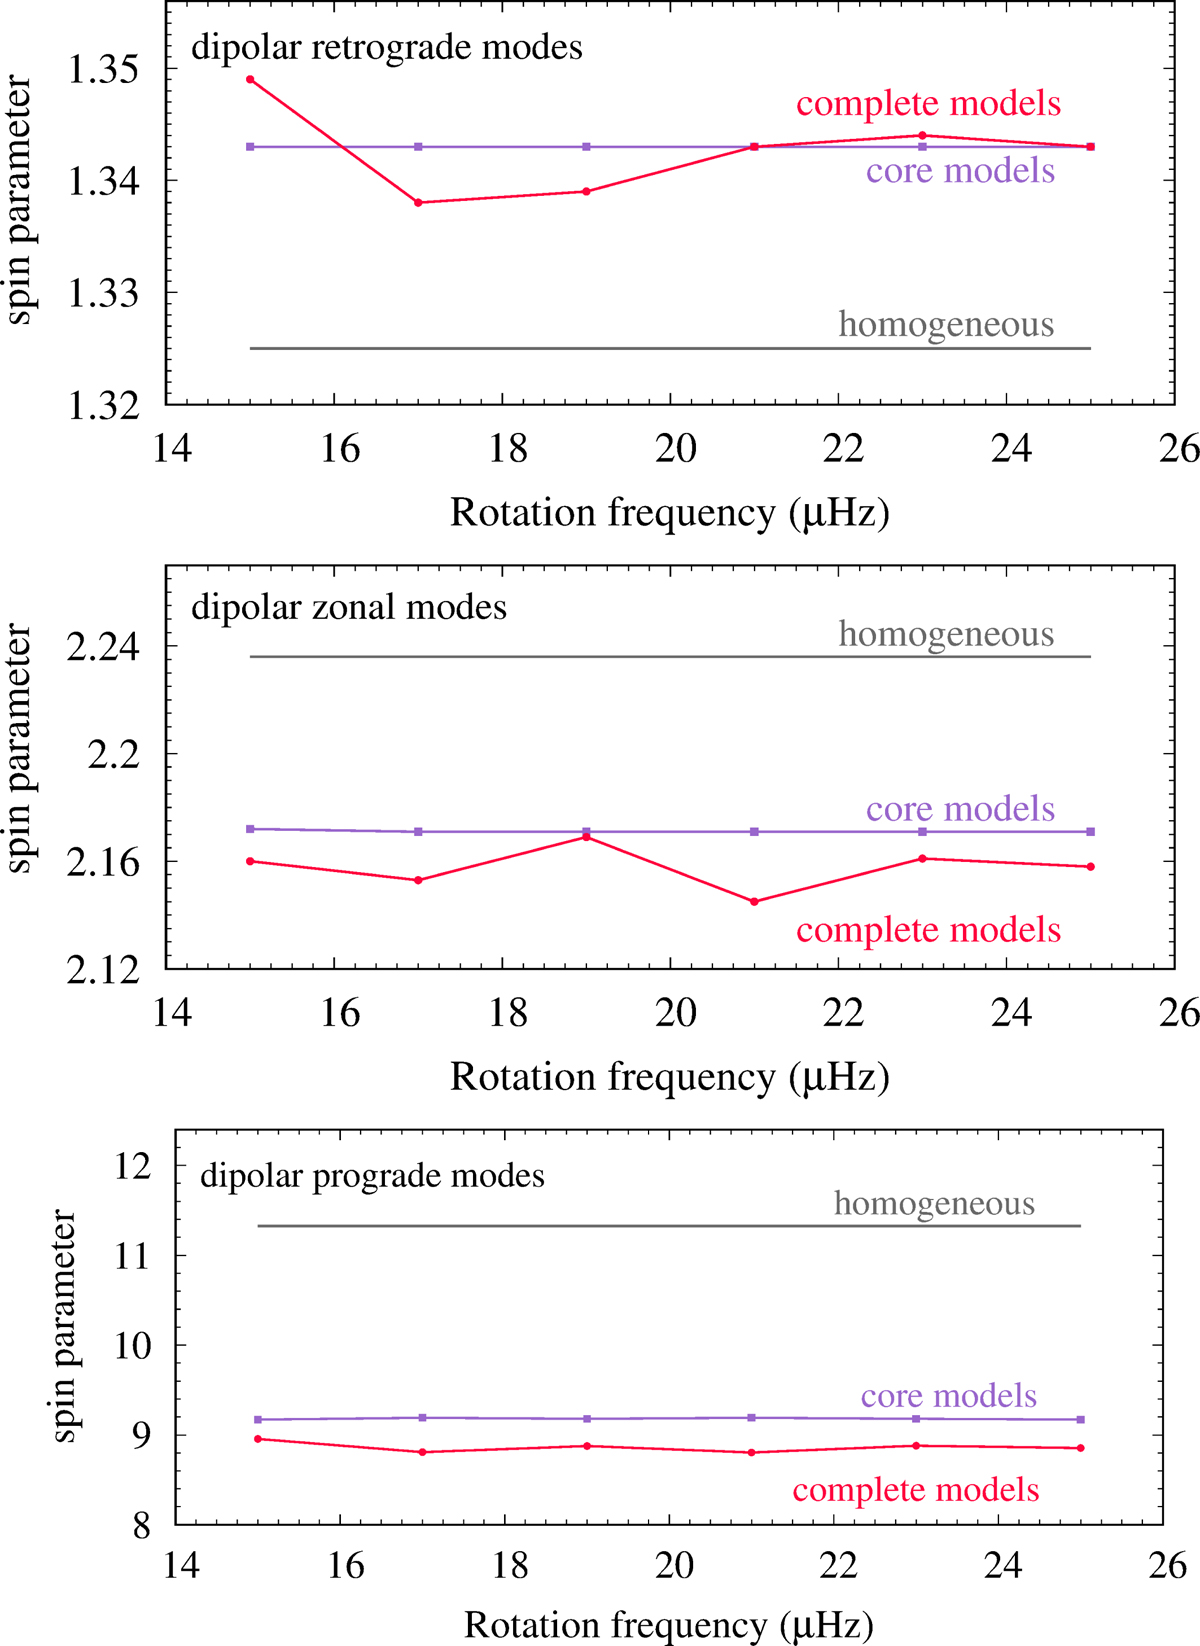
Values of spin parameters as a function of rotation frequency determined through three different methods. In pink are plotted the values computed with ACOR on the stellar model 2 m (see Sect. 3.2), the violet curves correspond to values computed in the truncated convective core of model 2 m (see Sect. 4.2), and the grey constant lines stand for the homogeneous spherical box case (see Sect. 2.1). These are given for dipolar retrograde modes (upper panel), zonal (middle), and prograde ones (lower panel).
Current usage metrics show cumulative count of Article Views (full-text article views including HTML views, PDF and ePub downloads, according to the available data) and Abstracts Views on Vision4Press platform.
Data correspond to usage on the plateform after 2015. The current usage metrics is available 48-96 hours after online publication and is updated daily on week days.
Initial download of the metrics may take a while.