Open Access
Fig. 5.
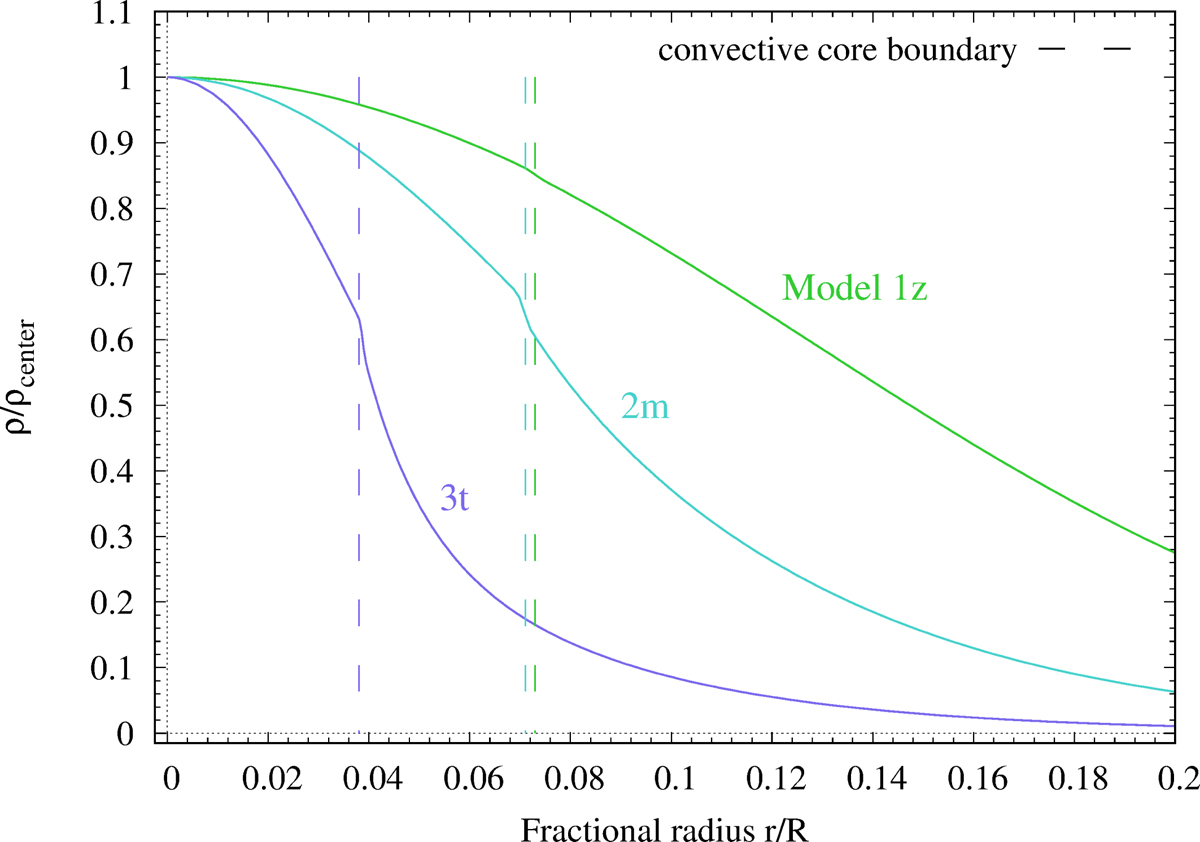
Density profile, scaled by the central value, for the three stellar models given in Table 2. The dashed line indicates the external boundary of the convective core for each model.
Current usage metrics show cumulative count of Article Views (full-text article views including HTML views, PDF and ePub downloads, according to the available data) and Abstracts Views on Vision4Press platform.
Data correspond to usage on the plateform after 2015. The current usage metrics is available 48-96 hours after online publication and is updated daily on week days.
Initial download of the metrics may take a while.