Fig. 5
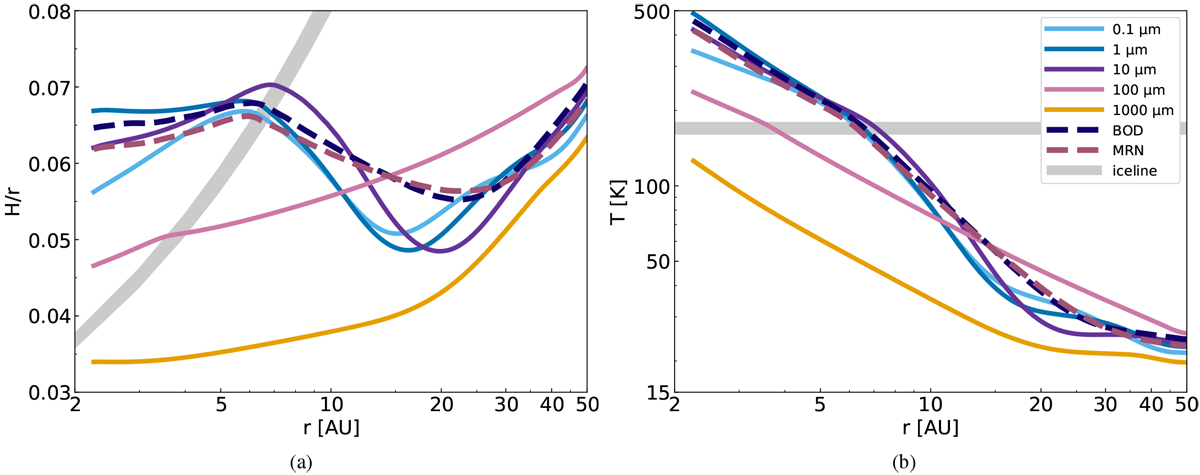
Aspect ratio (left plot) and midplane temperature (right plot) as a function of orbital distance in AU, for discs with five different single grain sizes from 0.1 μm to 1 mm (see Fig. 2 for the opacities of those five grain sizes). All of the simulations include viscous heating and stellar irradiation, have α = 5 × 10⁻³ as the turbulence parameter in viscosity, Σg,0 = 1000 g cm−2 as the initial gas surface density, and the dust-to-gas ratio is fDG = 1%. In this set of simulations, we also consider settling so that we can compare with the simulations that include the grain size distributions. The gray areas in the plot indicate the water iceline transition. Overplotted with dashed lines are the discs with the MRN distribution in reddish pink and the BOD distribution in dark blue. The simulations with the distributions show influence from small particles at the inner part of the disc, while the outer parts are mostly affected by larger particles, around 0.1 mm (see Fig. 8). The small differences in the aspect ratio and temperature of the discs with the distributions stem from the different slope of the vertically integrated dust surface densities of the two distributions (see Figs. 3 and A.1).
Current usage metrics show cumulative count of Article Views (full-text article views including HTML views, PDF and ePub downloads, according to the available data) and Abstracts Views on Vision4Press platform.
Data correspond to usage on the plateform after 2015. The current usage metrics is available 48-96 hours after online publication and is updated daily on week days.
Initial download of the metrics may take a while.