Fig. 3
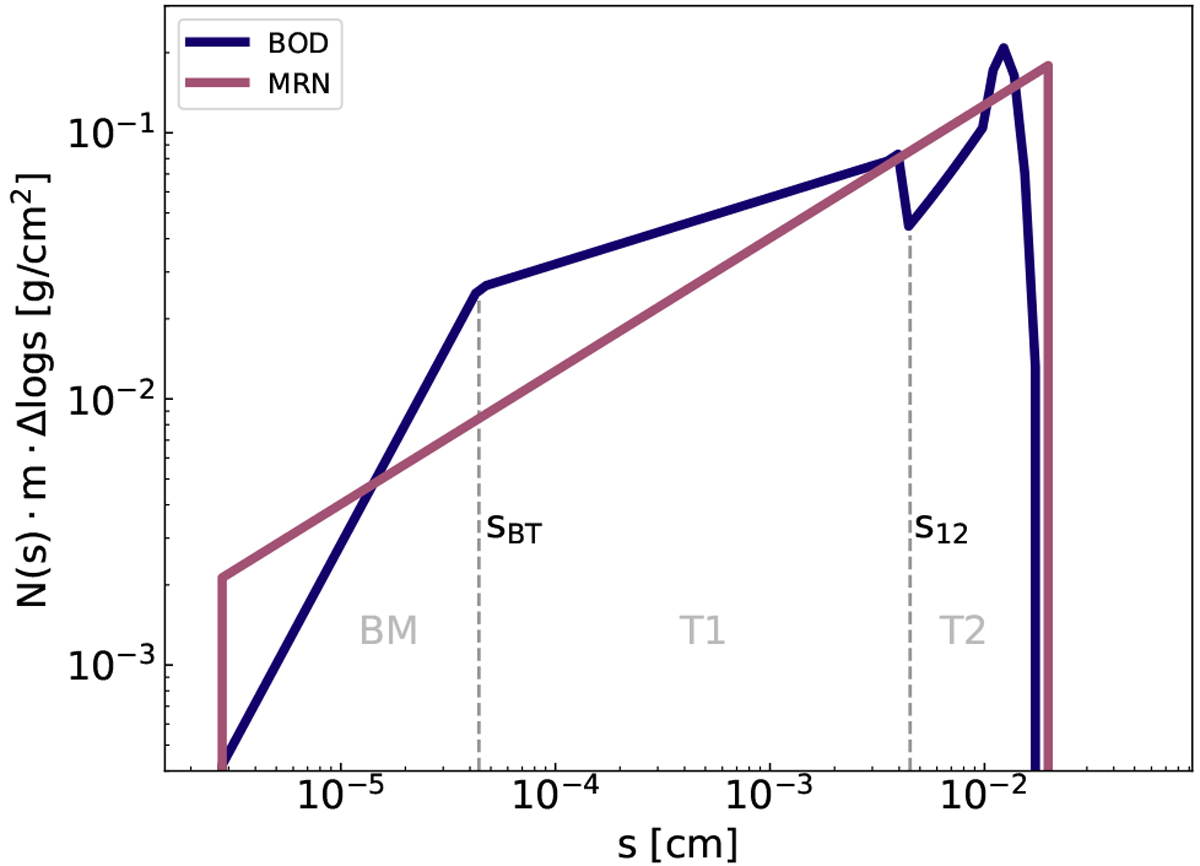
Vertically integrated dust surface density distribution per logarithmic bin of grain size as a function of grain size for the two distributions used here, after Birnstiel et al. (2011; BOD) and Mathis et al. (1977; MRN), at 10 AU, for the simulation with α = 5 × 10⁻³ (see Fig. A.1 for the distributions over all orbital distances). The dust to gas ratio is 1% and the gas surface density is 1000 g cm−2 at 1 AU in both cases. For both of the distributions we additionally used uf = 1 m s−1 and ρs = 1.6 g cm−3. In the BOD, we can distinguish three regions. Small particles follow Brownian motion (BM), then as they grow they followthe turbulent gas motions (T1), and finally they are affected by the turbulence, but get decoupled from the gas as their stopping times are much larger than the turn-over time of the eddies (T2). The barrier sBT is the grain size limit for Brownian motion, while the barrier s12 separates the two turbulent regimes. The bump near the end of the distribution is caused by cratering, since large particles only lose part of their mass this way, while small particles can only coagulate and form larger grains. This causes the distribution to be top-heavy. The MRN distribution is a single power-law (Eq. (13)). Both grain size distributions have a maximum value determined by the same fragmentation limit (Eq. (15)), but they are not the same for the BOD and the MRN distribution because of the self-consistently calculated temperature.
Current usage metrics show cumulative count of Article Views (full-text article views including HTML views, PDF and ePub downloads, according to the available data) and Abstracts Views on Vision4Press platform.
Data correspond to usage on the plateform after 2015. The current usage metrics is available 48-96 hours after online publication and is updated daily on week days.
Initial download of the metrics may take a while.