Fig. B.1
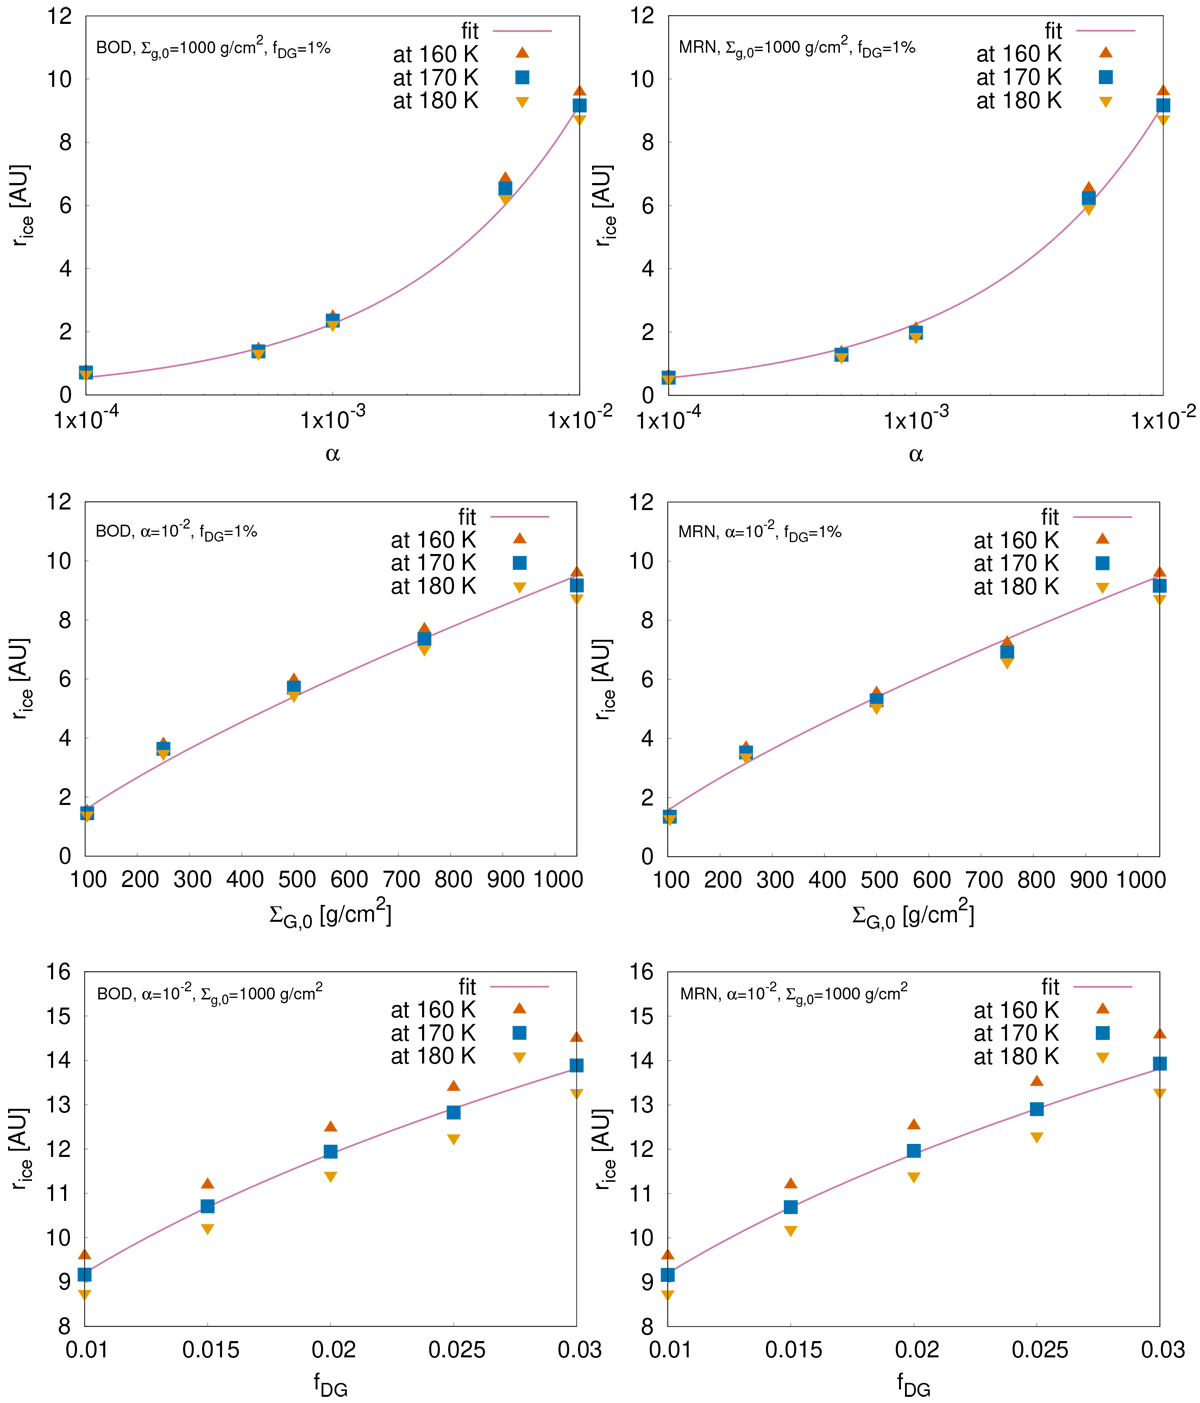
Iceline position as a function of α-viscosity (top), initial gas surface density (middle), and dust-to-gas ratio (bottom) for the discs with the BOD distribution (left column) and the discs with the MRN distribution (right column). The iceline transition is defined as T = (170 ± 10) K. The specific parameters used for the simulations presented in this plot are shown in Table B.1. The solid lines are the fits to each parameter and are the same for the discs with either one of the distributions.
Current usage metrics show cumulative count of Article Views (full-text article views including HTML views, PDF and ePub downloads, according to the available data) and Abstracts Views on Vision4Press platform.
Data correspond to usage on the plateform after 2015. The current usage metrics is available 48-96 hours after online publication and is updated daily on week days.
Initial download of the metrics may take a while.