Fig. A.2
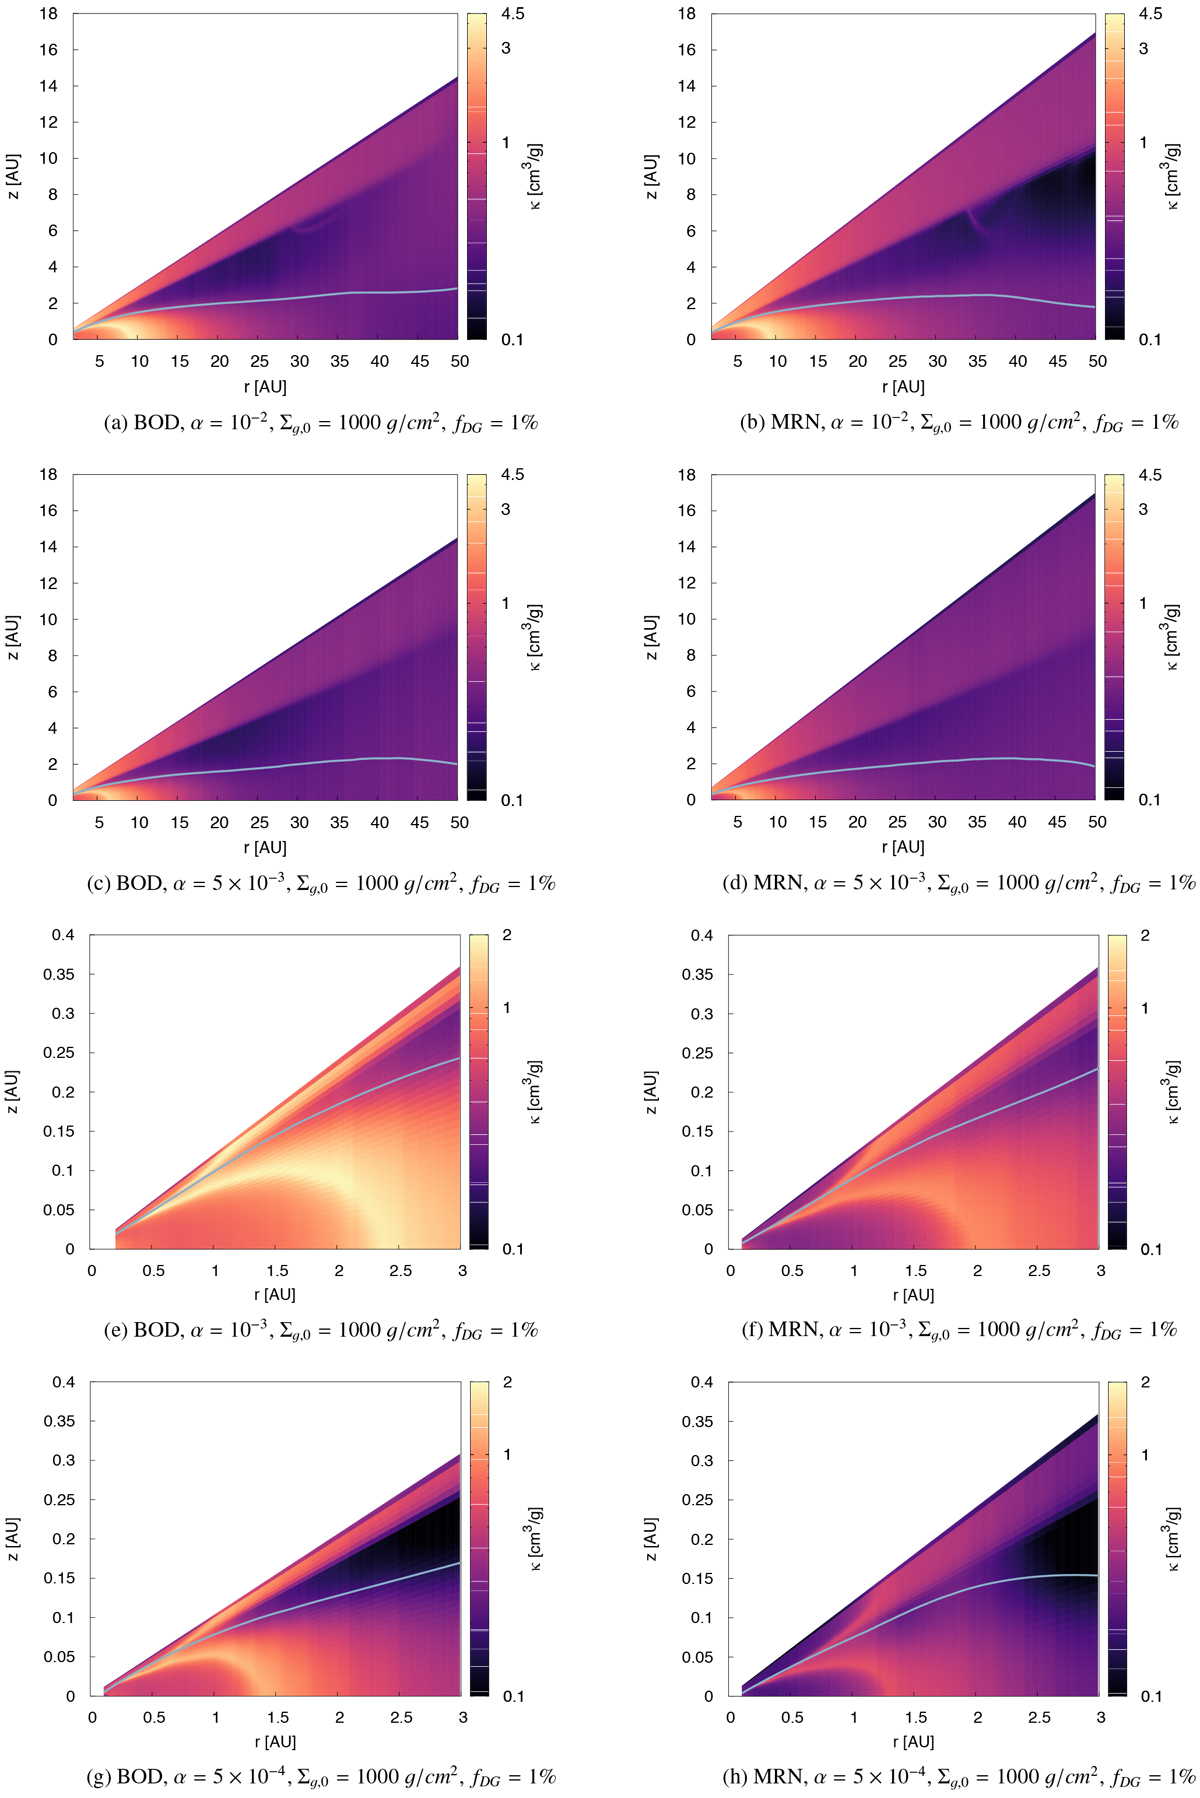
Mean Rosseland opacities as a function of orbital distance and height for the different α values, the lowest gas surface densities, and the highest dust-to-gas ratio. Due to the larger grain sizes for the MRN distribution (Fig. A.1), the opacities for the MRN distribution are also generally lower compared to the BOD distribution. The light blue line corresponds to optical depth τ = 1 integrated vertically starting from infinity towards midplane, so it divides the optically thin (above) and thick region (below).
Current usage metrics show cumulative count of Article Views (full-text article views including HTML views, PDF and ePub downloads, according to the available data) and Abstracts Views on Vision4Press platform.
Data correspond to usage on the plateform after 2015. The current usage metrics is available 48-96 hours after online publication and is updated daily on week days.
Initial download of the metrics may take a while.