Fig. 12
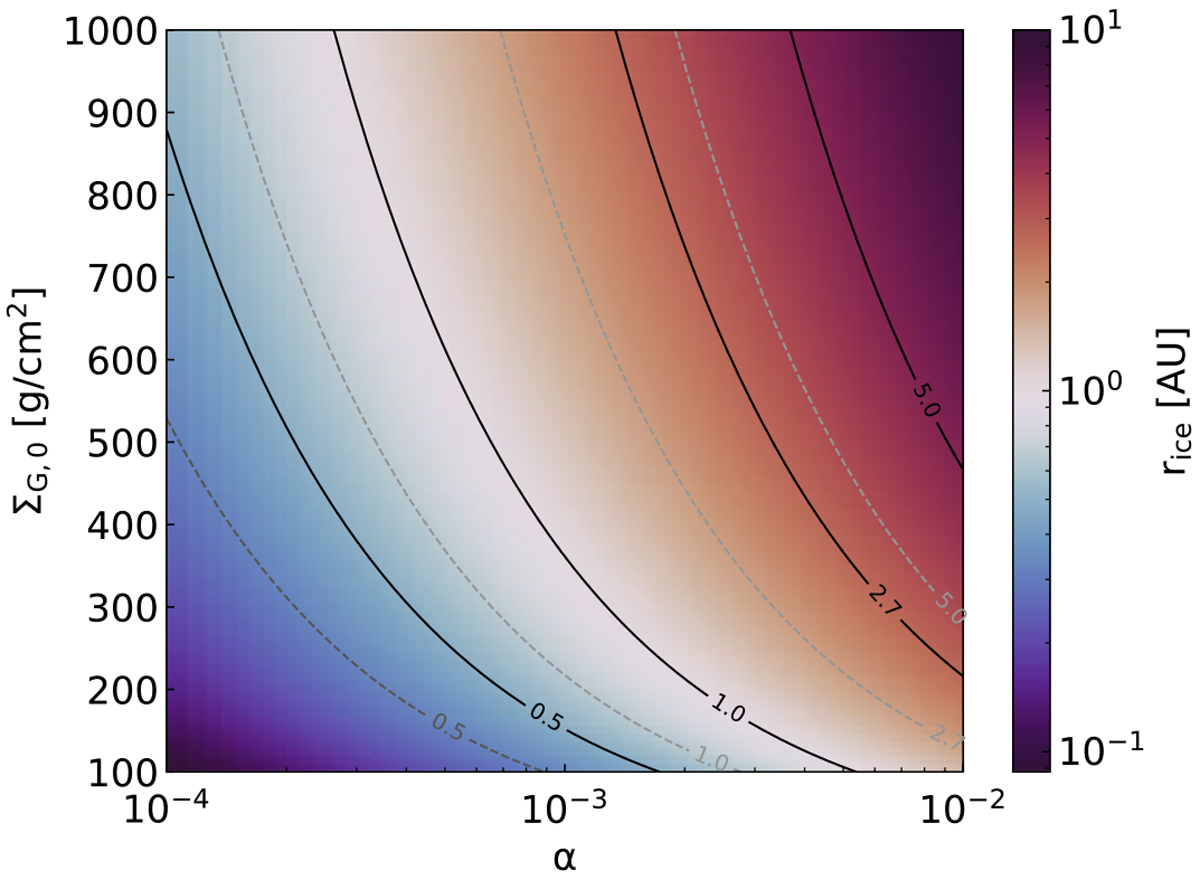
Iceline position as a function of α turbulence and initial gas surface density at 1 AU with a constant fDG = 1% (Eq. (26)). The iceline transition is defined as T = 170 ± 10 K. The black lines mark rice = 0.5, 1, 2.7 and 5 AU. Higher viscosity or gas surface density leads to hotter discs, with the iceline located at greater distances from the star. The same applies to higher total dust-to-gas ratio. The gray dashed lines mark rice = 0.5, 1, 2.7 and 5 AU for a disc with fDG = 3%.
Current usage metrics show cumulative count of Article Views (full-text article views including HTML views, PDF and ePub downloads, according to the available data) and Abstracts Views on Vision4Press platform.
Data correspond to usage on the plateform after 2015. The current usage metrics is available 48-96 hours after online publication and is updated daily on week days.
Initial download of the metrics may take a while.