Fig. 7.
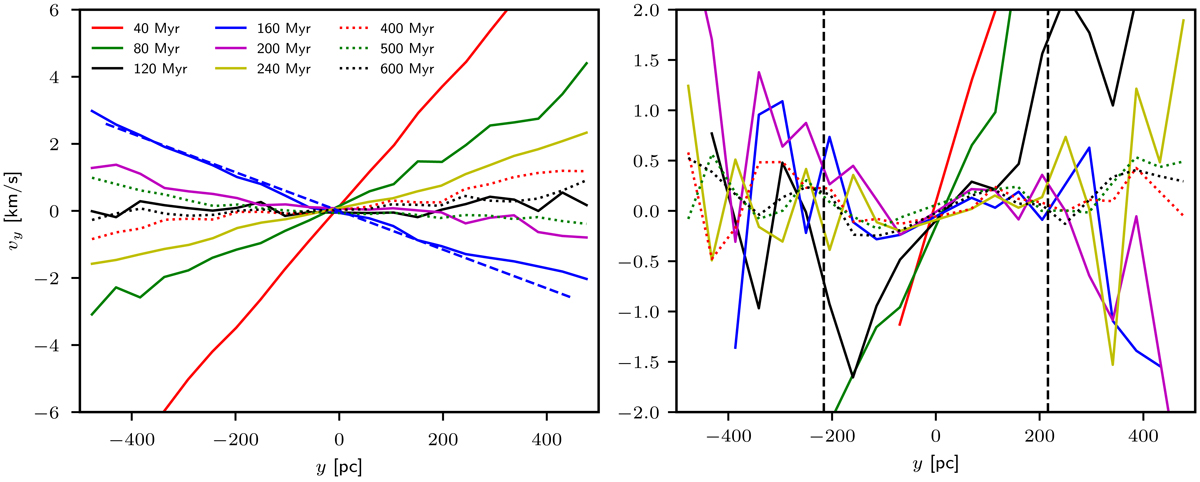
Evolution of the bulk velocity vy of the tidal tail along the direction y at selected times as indicated by solid or dotted lines. Left panel: model C10G13. The blue dashed line indicates the analytical solution given by Eq. (19) at t = 168 Myr. Right panel: model C10W1. The vertical dashed lines represent the positions of yC according to Küpper et al. (2008). The epicyclic overdensities, which develop near the predicted positions ±240 pc at 400−600 Myr, are places where stars slow down or even reverse their motion (i.e. move towards the cluster).
Current usage metrics show cumulative count of Article Views (full-text article views including HTML views, PDF and ePub downloads, according to the available data) and Abstracts Views on Vision4Press platform.
Data correspond to usage on the plateform after 2015. The current usage metrics is available 48-96 hours after online publication and is updated daily on week days.
Initial download of the metrics may take a while.