Fig. 6.
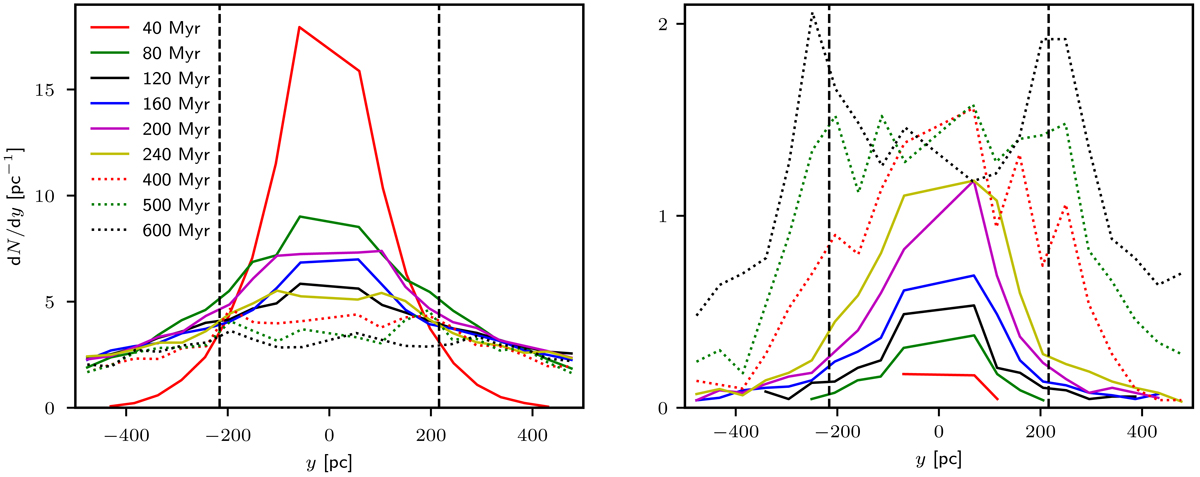
Number density distribution of the tail as a function of the distance y along the tail for model C10G13 (left panel) and model C10W1 (right panel) at selected times as indicated by the lines. Plots at times earlier than 300 Myr (solid lines) do not indicate epicyclic overdensities. Epicyclic overdensities appear later (400−600 Myr; dotted lines). The epicyclic overdensities are located at a distance very close to the one predicted by Küpper et al. (2008), which is indicated by the vertical dashed lines.
Current usage metrics show cumulative count of Article Views (full-text article views including HTML views, PDF and ePub downloads, according to the available data) and Abstracts Views on Vision4Press platform.
Data correspond to usage on the plateform after 2015. The current usage metrics is available 48-96 hours after online publication and is updated daily on week days.
Initial download of the metrics may take a while.