Fig. 4.
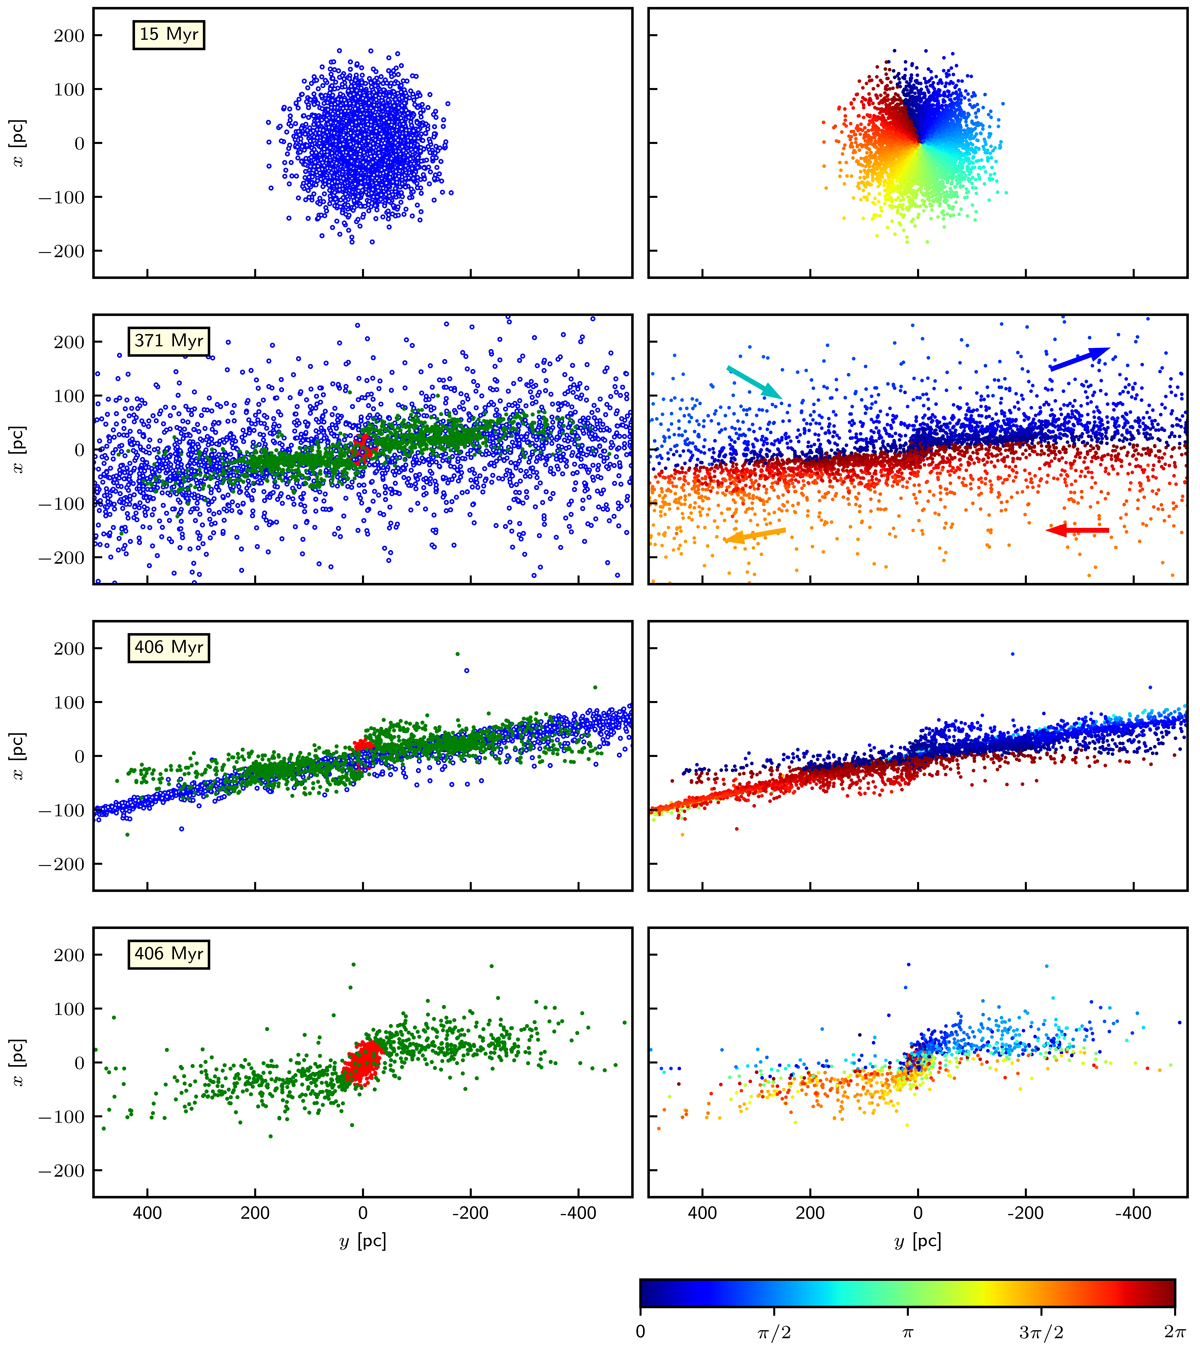
Morphology of the tidal tails. From top to bottom: model C10G13 at 15 Myr, model C10G13 at 371 Myr (maximum thickness of tail I), model C10G13 at 406 Myr (minimum thickness of tail I), and model C10W1 at 406 Myr. Each star is represented by a coloured dot. Left column: structure of tail I (blue dots) and tail II (green dots). Members of the star cluster are shown as red dots. Right column: direction of stellar motion in the tails. The colour gives the direction of motion where the angle is measured clockwise from the unit vector pointing in the direction of positive x-axis (see the arrows in the upper middle panel and the colour bar). The cluster moves in the positive y direction around the Galaxy.
Current usage metrics show cumulative count of Article Views (full-text article views including HTML views, PDF and ePub downloads, according to the available data) and Abstracts Views on Vision4Press platform.
Data correspond to usage on the plateform after 2015. The current usage metrics is available 48-96 hours after online publication and is updated daily on week days.
Initial download of the metrics may take a while.