Fig. 12.
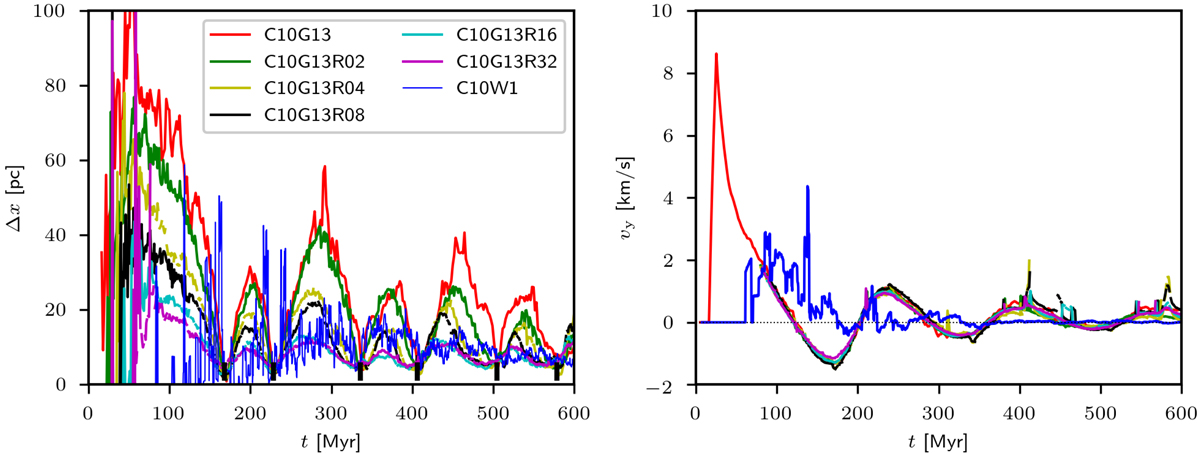
Left panel: evolution of tail thickness Δx for models of different values of the initial velocity dispersion. The events of the minimum of tail thickness (Eq. (16)) are indicated by the black bars. Right panel: evolution of the bulk velocity vy. For clarity, we do not plot the first 80 Myr of evolution for some of the models.
Current usage metrics show cumulative count of Article Views (full-text article views including HTML views, PDF and ePub downloads, according to the available data) and Abstracts Views on Vision4Press platform.
Data correspond to usage on the plateform after 2015. The current usage metrics is available 48-96 hours after online publication and is updated daily on week days.
Initial download of the metrics may take a while.