Fig. 10.
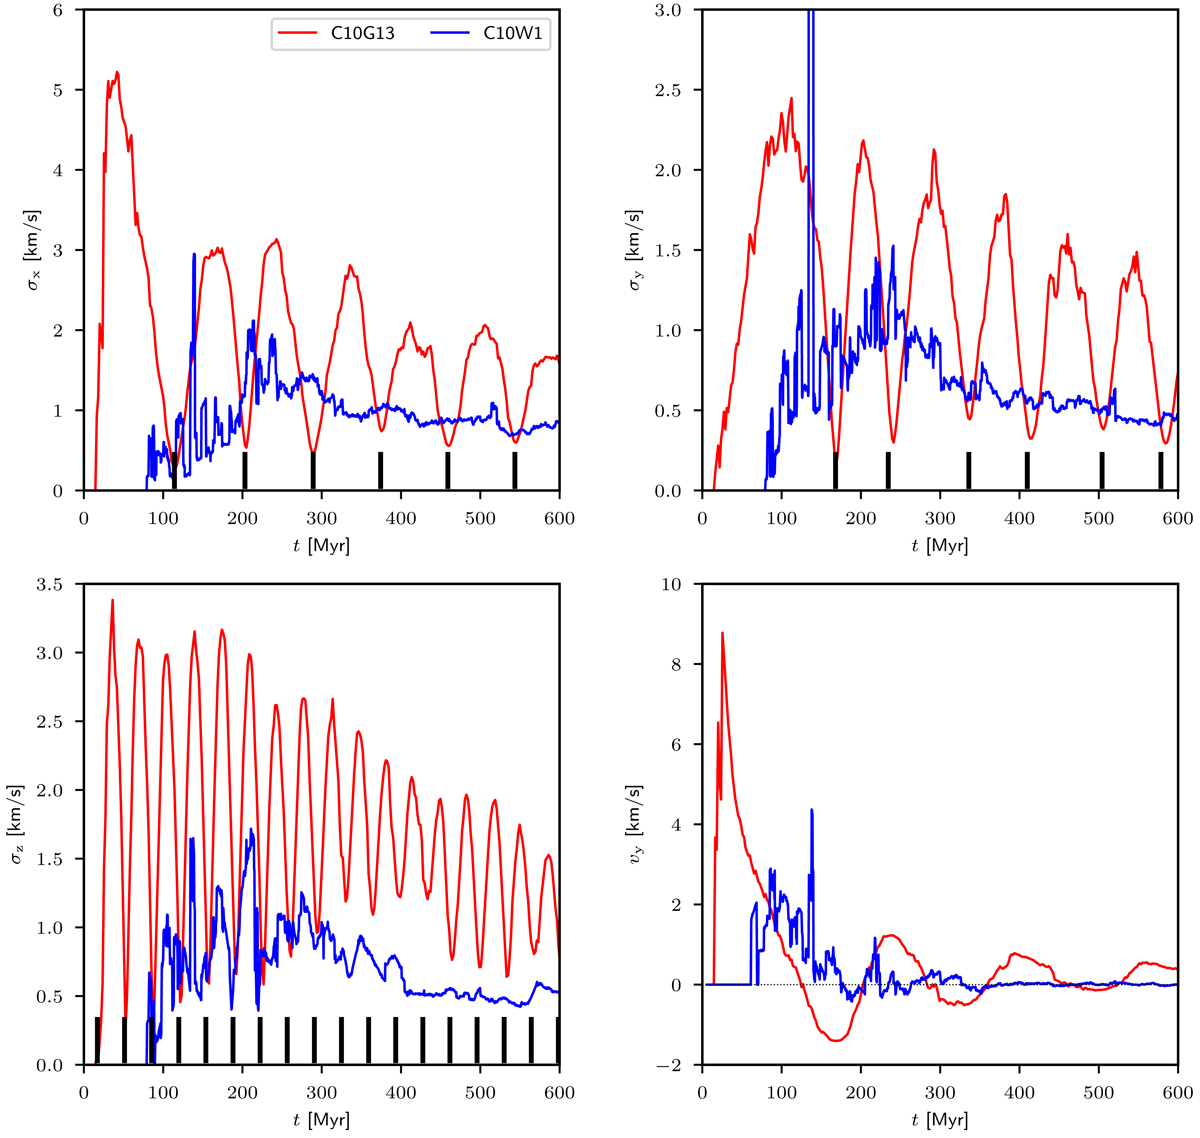
Comparison of the tail velocity structure between models C10G13 (red lines) and C10W1 (blue lines) at 200 pc < y < 300 pc. Upper left: velocity dispersion σx. Upper right: velocity dispersion σy. Lower left: velocity dispersion σz. The minima of velocity dispersions, as calculated from Eqs. (17), (18), and (4), are indicated by the black bars. Lower right: vy component of the mean bulk tail velocity.
Current usage metrics show cumulative count of Article Views (full-text article views including HTML views, PDF and ePub downloads, according to the available data) and Abstracts Views on Vision4Press platform.
Data correspond to usage on the plateform after 2015. The current usage metrics is available 48-96 hours after online publication and is updated daily on week days.
Initial download of the metrics may take a while.