Fig. 8.
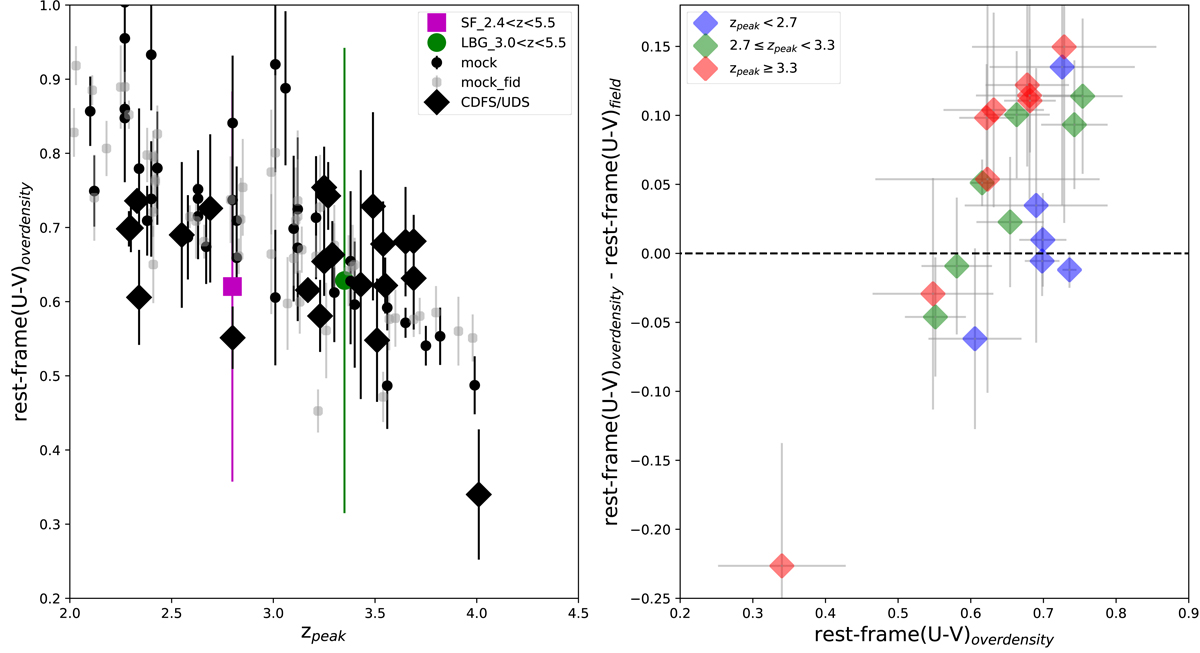
Leftpanel: mean rest-frame U − V color of the galaxies in the 22 overdensities identified at 2 < z < 4 versus redshift of their highest-density peaks (big black diamonds). We, also, show mean color and mean photometric redshift for star-forming galaxies (big magenta squares) and Lyman Break galaxies (big green circles) as classified in Pentericci et al. (2018a) and for the structures detected in the mocks, in the fiducial run (small gray circles) and in the run with parameters as in the real data (small black circles). Rightpanel: difference between the mean rest-frame U − V color of the overdensity members and the mean rest-frame U − V color of field galaxies versus the mean rest-frame U − V color of the overdensity members. The color coding indicates the redshift of the highest-density peak of the identified overdensities, blue for z < 2.7, green for 2.7 ≤ z ≤ 3.3, and red for z > 3.3. The error bars correspond to the standard error of the means. As a reference, the rest-frame U − V color for a representative cluster at z = 0 is equal to 1.4 and that of field galaxies is 0.5. To derive these values, we assume that a z = 0 cluster contains a well defined red sequence with a dominance of E and S0 galaxies and that field galaxies are a blue population (Fukugita et al. 1995).
Current usage metrics show cumulative count of Article Views (full-text article views including HTML views, PDF and ePub downloads, according to the available data) and Abstracts Views on Vision4Press platform.
Data correspond to usage on the plateform after 2015. The current usage metrics is available 48-96 hours after online publication and is updated daily on week days.
Initial download of the metrics may take a while.