Fig. 7.
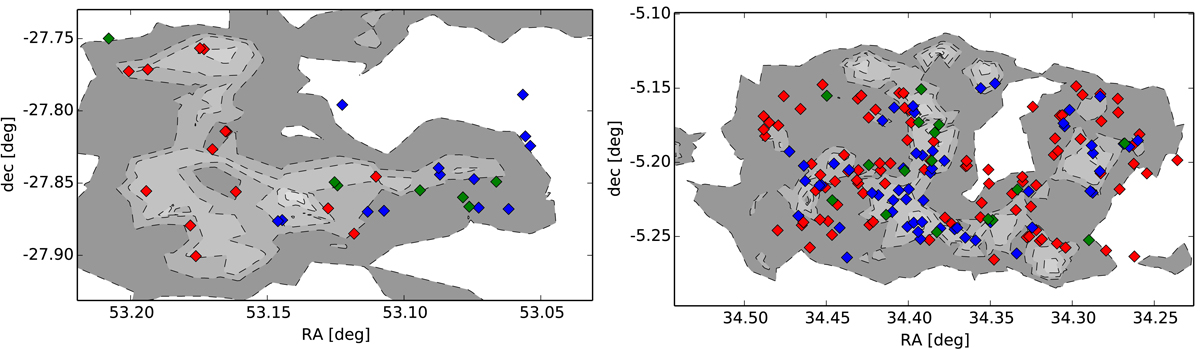
Density map of two peculiar overdensities. The structures at z = 3.17 in the CDFS is shown in the leftpanel, the structures at z = 2.33 in the UDS is shown in the rightpanel. Red diamonds correspond to the spectroscopic members within the lowest redshift peaks, blue diamonds to the intermediate redshift peaks, green diamonds to the highest redshift peaks as seen in Fig. 6 and explained in the text.
Current usage metrics show cumulative count of Article Views (full-text article views including HTML views, PDF and ePub downloads, according to the available data) and Abstracts Views on Vision4Press platform.
Data correspond to usage on the plateform after 2015. The current usage metrics is available 48-96 hours after online publication and is updated daily on week days.
Initial download of the metrics may take a while.