Free Access
Fig. 5.
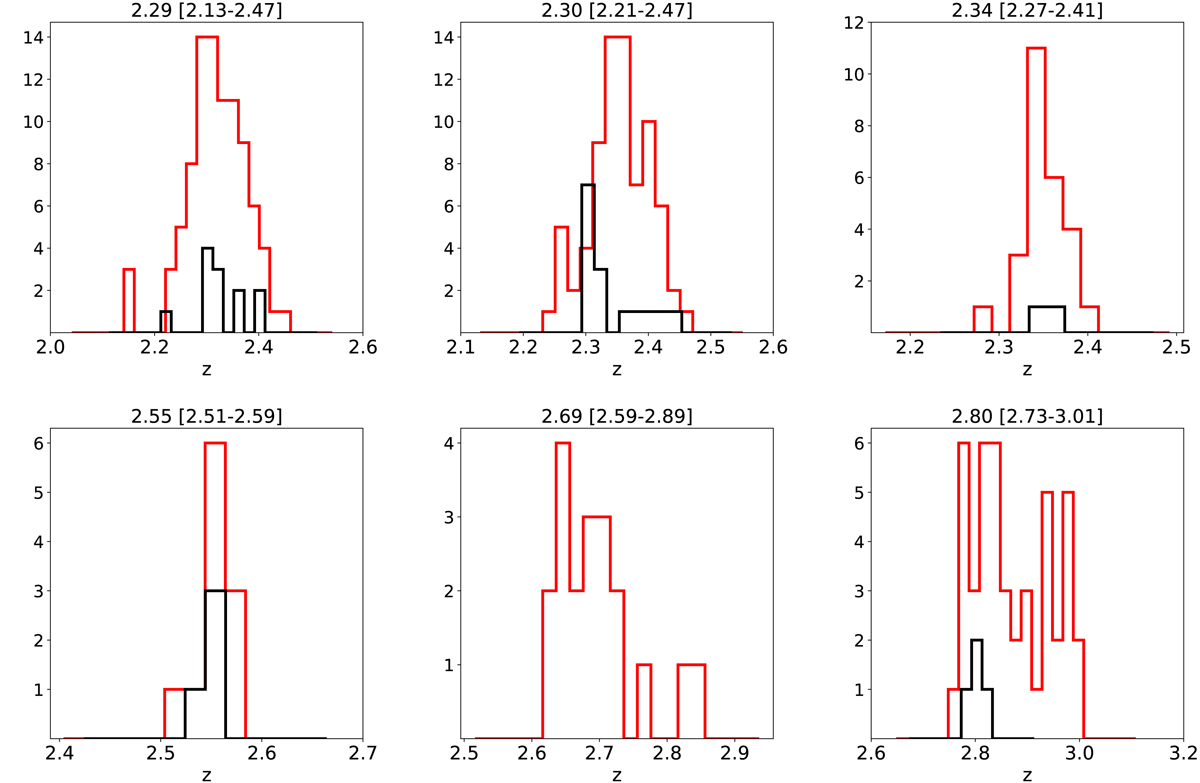
Redshift distribution of the galaxies in the overdensities identified in the CDFS. The red histograms include both spectroscopic and photometric redshifts, while black histograms only the spectroscopic ones. The histogram bin is 0.02 in redshift. Some of overdensities are likely composed of more than one density peak.
Current usage metrics show cumulative count of Article Views (full-text article views including HTML views, PDF and ePub downloads, according to the available data) and Abstracts Views on Vision4Press platform.
Data correspond to usage on the plateform after 2015. The current usage metrics is available 48-96 hours after online publication and is updated daily on week days.
Initial download of the metrics may take a while.