Fig. 4.
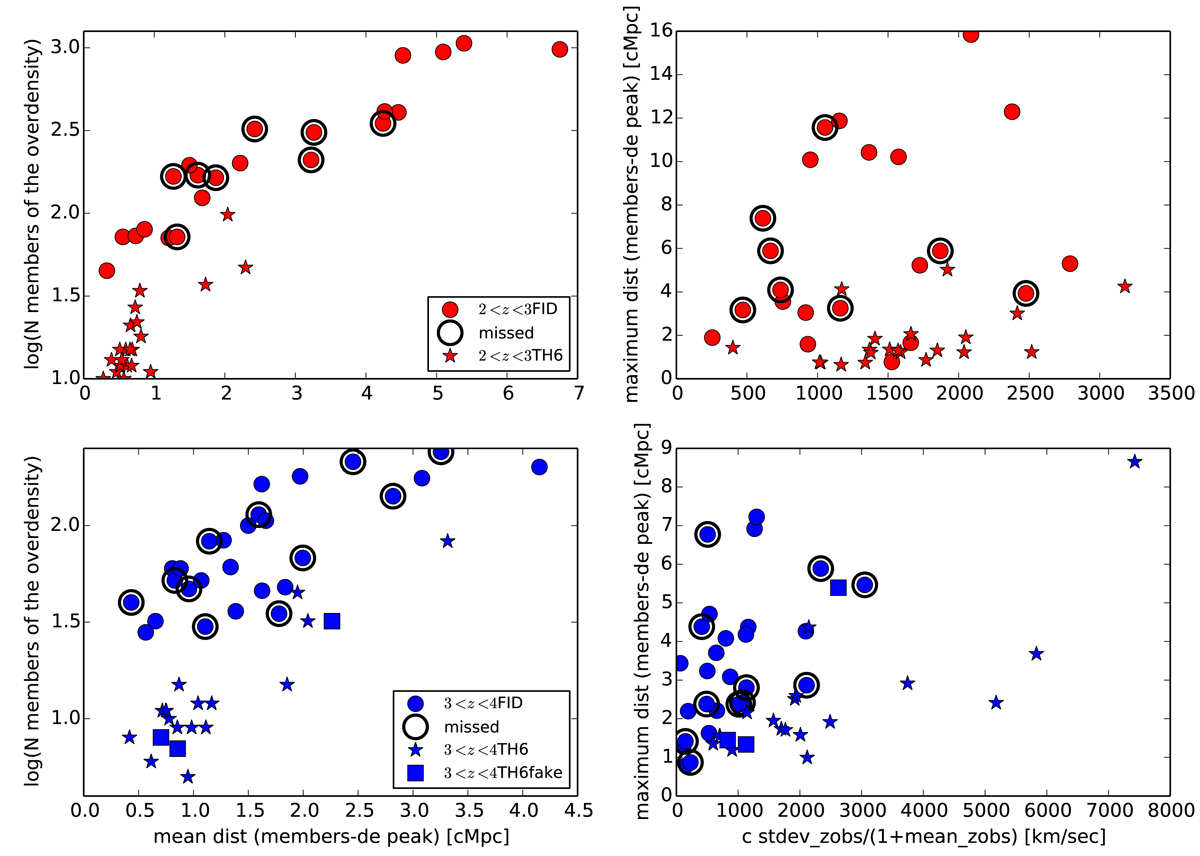
Properties of the overdensities detected among the mock galaxies with isel ≤ 27.5 at 2 < z < 3 (red) and 3 < z < 4 (blue). The properties of the fiducial run overdensities (2 < z < 3FID and 3 < z < 4FID) are shown as dots and the properties of the overdensities detected after including zphot errors (mimicking the VANDELS data) and adopting THRESHOLD = 6 (2 < z < 3TH6 and 3 < z < 4TH6) are shown as stars. The leftpanels show the total number of members versus the mean distance between the members and the highest-density peak, the rightpanels show the maximum distance between the members and the highest-density peak and the standard deviation of the observed redshifts in velocity [c × stdev(zobs)]/[1 + mean(zobs)]. The fiducial-run overdensities missed after applying photometric uncertainties are indicated with black circles around the dots (missed). The ‘fake’ overdensities at z ∼ 3 (3 < z < 4TH6fake), not detected in the fiducial run, are shown as squares. To read this figure, we remind that each star (recovered overdensity) corresponds to a dot (fiducial-run overdensity) without black circle. The overdensities detected among the mock galaxies with isel ≤ 26.1 share the same properties of the ones detected among the mock galaxies with isel ≤ 27.5.
Current usage metrics show cumulative count of Article Views (full-text article views including HTML views, PDF and ePub downloads, according to the available data) and Abstracts Views on Vision4Press platform.
Data correspond to usage on the plateform after 2015. The current usage metrics is available 48-96 hours after online publication and is updated daily on week days.
Initial download of the metrics may take a while.