Fig. 3.
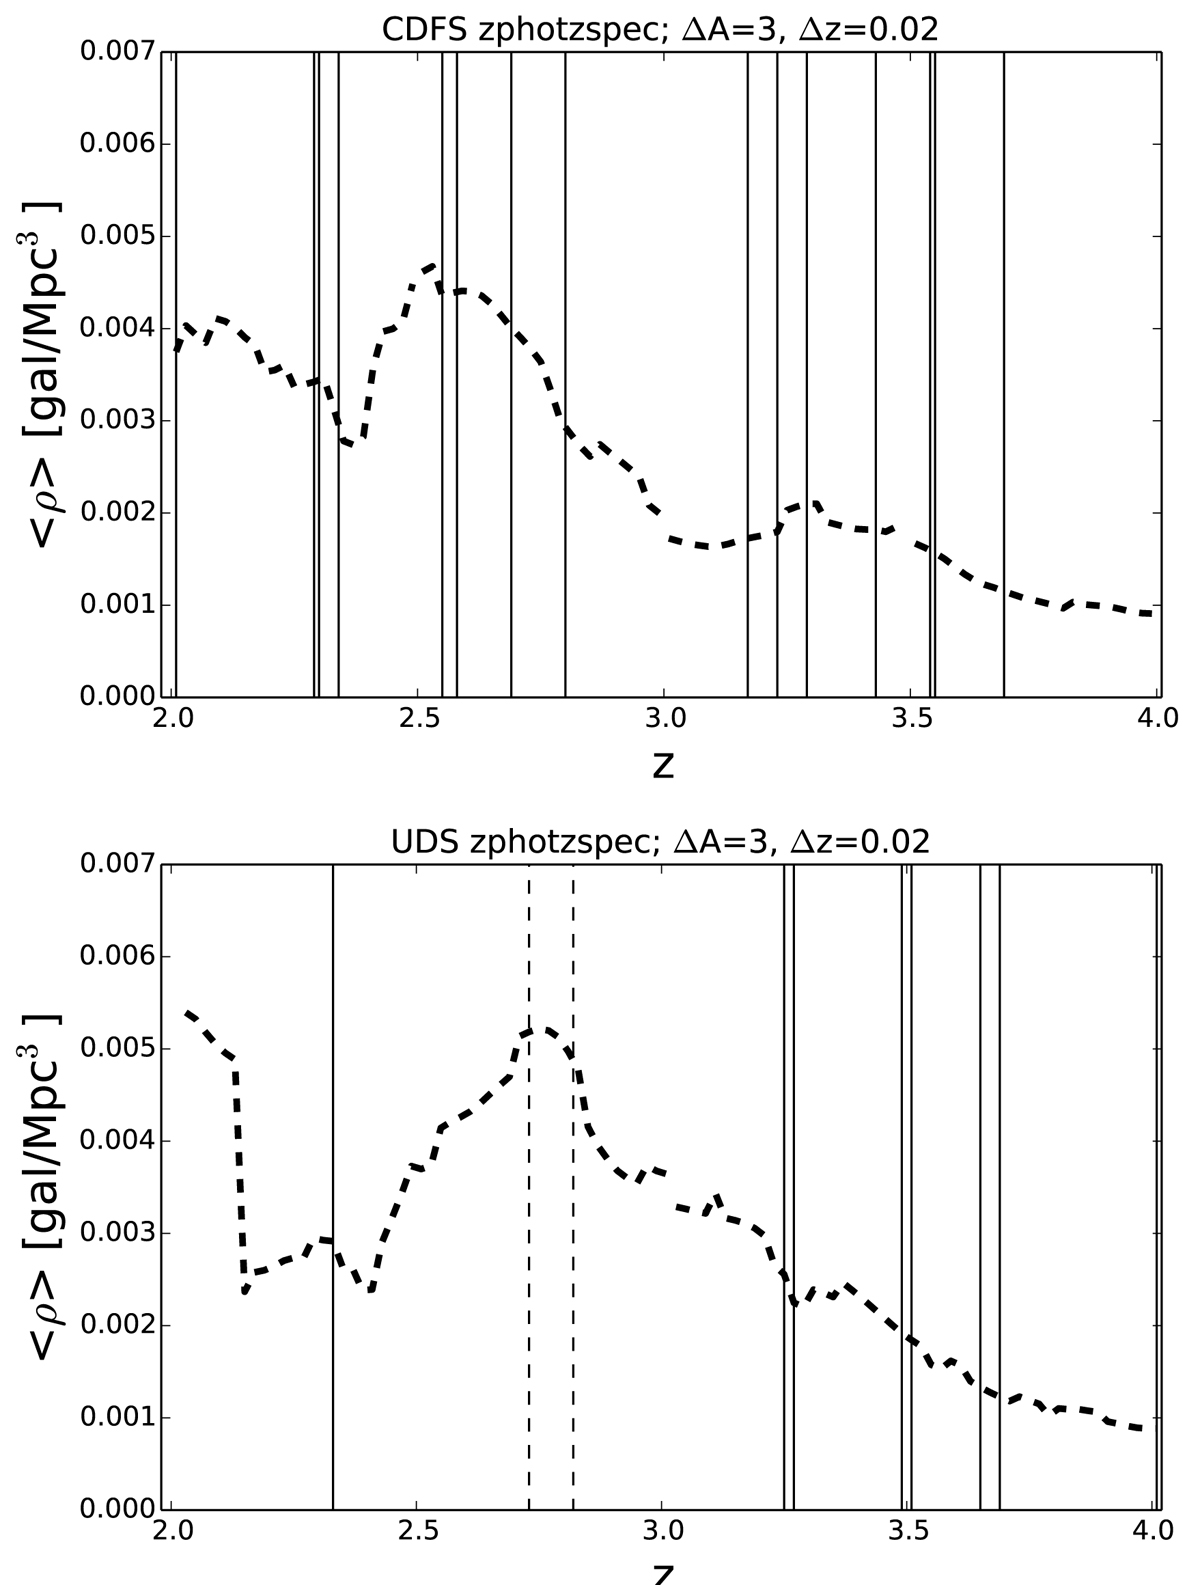
Mean local density versus redshift for the CDFS (upper panel) and for the UDS (lower panel) shown as dashed solid curves. The mean corresponds to the average of the local density values in each bins of Δz = 0.02, after the application of sigma clipping, as explained in the text. Vertical solid lines represent the redshifts of the detected overdensities. In the lower panel, vertical dashed lines correspond to two slightly lower-threshold overdensities at z ∼ 2.8 (THRESHOLD = 4 instead of 6).
Current usage metrics show cumulative count of Article Views (full-text article views including HTML views, PDF and ePub downloads, according to the available data) and Abstracts Views on Vision4Press platform.
Data correspond to usage on the plateform after 2015. The current usage metrics is available 48-96 hours after online publication and is updated daily on week days.
Initial download of the metrics may take a while.