Fig. B.1.
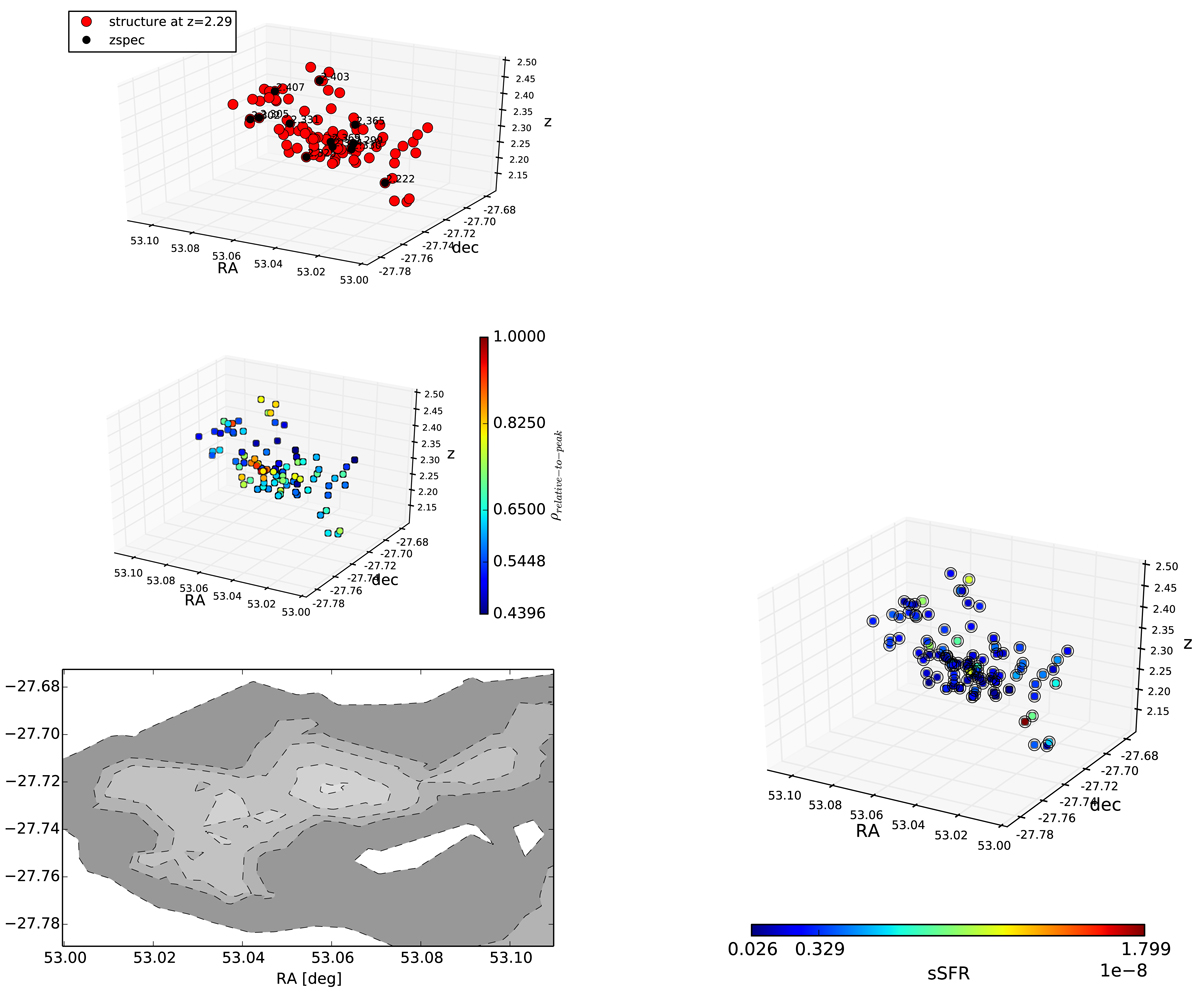
3D visualization of the overdensity identified at z = 2.29 in the CDFS. In the firstpanel, we show the overdensity members in the RA,dec,redshift space in red. The members with spectroscopic redshifts either from VANDELS or from the literature are shown in black with the black numbers indicating the zspec. In the secondpanel, the color coding is the density associated to each member with respect to density associated to the highest-density peak. The thirdpanel shows the density map in 2D. The contours represent 3, 2, 1, 0.5σ over the mean value of the local densities associated to the galaxies in the redshift range, zpeak − 0.05 < z < zpeak + 0.05, where zpeak is the redshift of the highest-density peak and it is shown for reference. The fourthpanel is as the first one, but the color coding of the symbols refers to the sSFR. The horizontal color-bar label shows the minimum, the mean, and the maximum value of sSFR.
Current usage metrics show cumulative count of Article Views (full-text article views including HTML views, PDF and ePub downloads, according to the available data) and Abstracts Views on Vision4Press platform.
Data correspond to usage on the plateform after 2015. The current usage metrics is available 48-96 hours after online publication and is updated daily on week days.
Initial download of the metrics may take a while.