Fig. A.1.
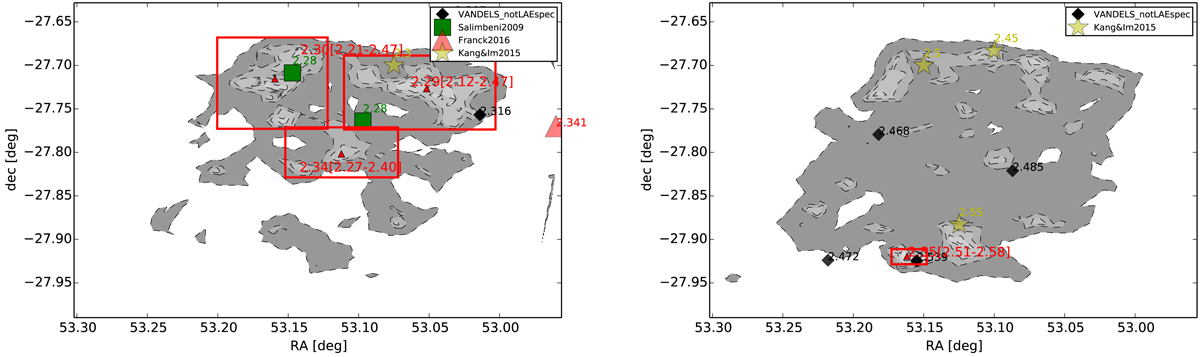
Density levels for galaxies at 2.25 < z < 2.35 (left) and 2.45 < z < 2.55 (right) in the CDFS. The contours represent 3, 2, 1, 0.5σ over the mean value of the local densities associated to the galaxies in the indicated redshift bin. Spectroscopic redshifts from VANDELS (VANDELS_notLAEspec) are indicated as black diamonds, VANDELS LAEs are indicated as red stars. For them, we also indicate the spectroscopic redshifts. Red rectangles represent the location of the identified overdensities. The center of these structures is shown with red triangles. The redshift of the highest-density peak and the redshift range of the structures is written in red. We also show the position of the center of structures detected in the literature in the same field and in the same redshift ranges, Salimbeni et al. (2009; green squares), Franck & McGaugh (2016; big red triangles), Kang & Im (2015; yellow stars). We write the redshifts of the literature-structure cores in green, red, and yellow, respectively.
Current usage metrics show cumulative count of Article Views (full-text article views including HTML views, PDF and ePub downloads, according to the available data) and Abstracts Views on Vision4Press platform.
Data correspond to usage on the plateform after 2015. The current usage metrics is available 48-96 hours after online publication and is updated daily on week days.
Initial download of the metrics may take a while.