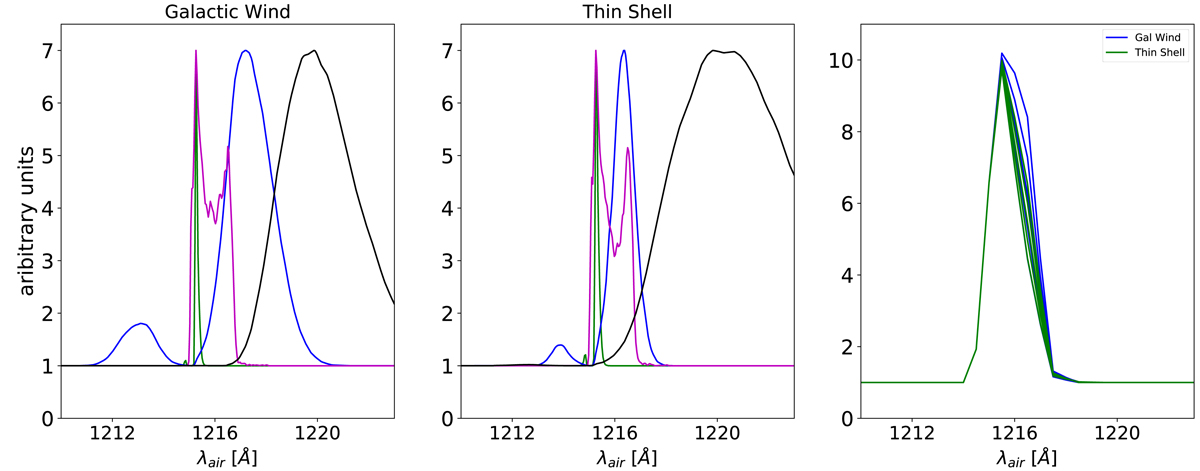
Fig. 15.
Predicted Lyα profiles obtained with the FLaREON model. We present profiles obtained assuming the geometry of a galactic wind (left) and of a thin shell (middle), the typical dust reddening of the LAEVs in our identified overdensities, and considering the median IGM transmission curve of the top 50% dense environments at z = 3.0, as explained in the text. The model curves are arbitrarily normalized to the height of the stacked Lyα profile of LAEVs in our identified overdensities (Fig. 12). The different curves represent the following combinations of parameters, Vexp = 10 km sec−1, log(NHI) = 18 (green); Vexp = 10 km sec−1, log(NHI) = 21.3 (blue); Vexp = 200 km sec−1, log(NHI) = 18 (magenta); Vexp = 200 km sec−1, log(NHI) = 21.3 (black) for the galactic wind geometry; Vexp = 10 km sec−1, log(NHI) = 18 (green); Vexp = 10 km sec−1, log(NHI) = 21.5 (blue); Vexp = 200 km sec−1, log(NHI) = 18 (magenta); Vexp = 200 km sec−1, log(NHI) = 21.5 (black) for the thin shell geometry. The rightpanel shows models obtained assuming Vexp = 160, 170, 180, 190, 200 km sec−1 and log(NHI) = 19, where the widest profile corresponds to highest velocity for the geometry of a galactic wind (blue) and of a thin shell (green). The curves are arbitrarily normalized to the height of the stacked Lyα profile of LAEVs in the field.
Current usage metrics show cumulative count of Article Views (full-text article views including HTML views, PDF and ePub downloads, according to the available data) and Abstracts Views on Vision4Press platform.
Data correspond to usage on the plateform after 2015. The current usage metrics is available 48-96 hours after online publication and is updated daily on week days.
Initial download of the metrics may take a while.