Fig. 12.
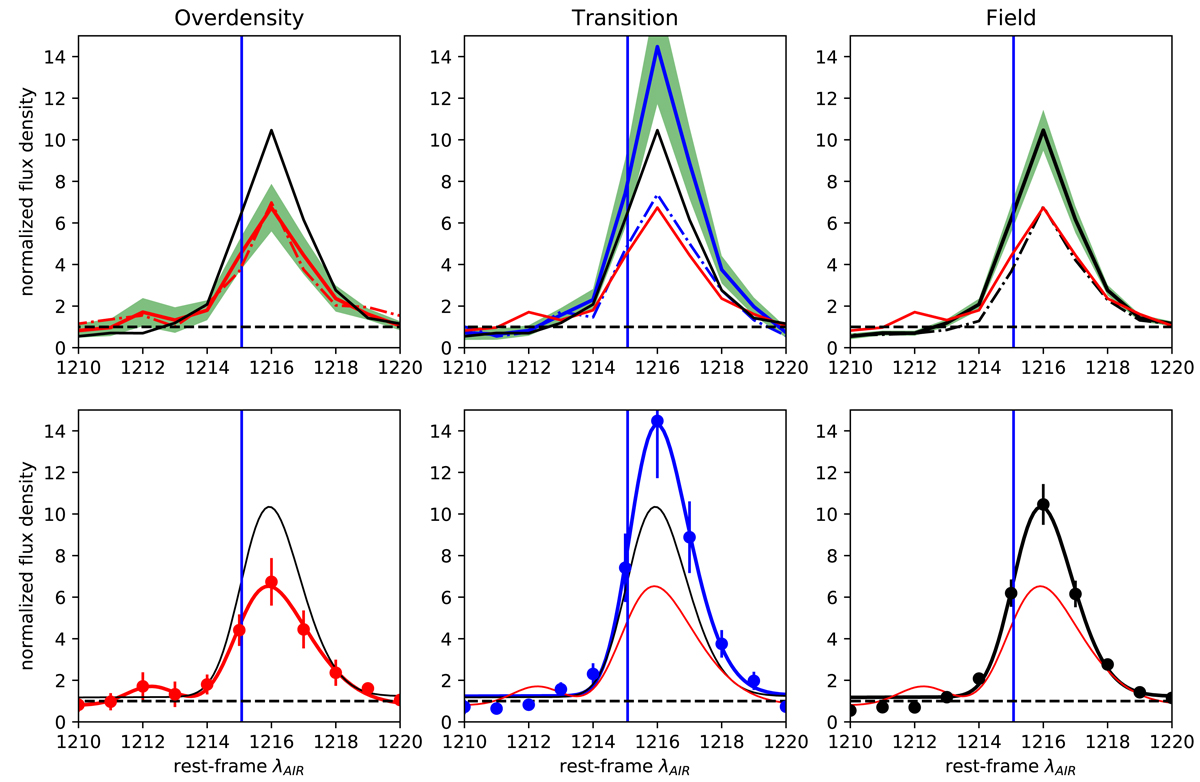
Upper panels: stacks of the Lyα profiles of the LAEVs in the identified overdensities (leftpanel), transition (middlepanel), and field (rightpanel) regions. The green shaded areas indicate the standard deviation of the mean of the fluxes at each wavelength among all the LAEVs in a certain density category. The observed profiles of the LAEVs in overdensity (transition) (field) regions is shown in red (blue) (black) in every panel. The dashed-dotted lines show the median stacks. Lower panels: asymmetric Gaussian curves, best fits of the stacks (dots with errorbars) in the upper panels. In each panel, red is used for the LAEVs in the identified overdensities, blue for the LAEVs in transition regions, black for the LAEVs in the field. The best fits of the asymmetric Gaussian curves provide the following parameters (λ, FWHM, A) = (1215, 4 Å, 0.86), (1215, 3 Å, 0.95), and (1215, 3 Å, 0.83) for the left, middle, and right stack, respectively.
Current usage metrics show cumulative count of Article Views (full-text article views including HTML views, PDF and ePub downloads, according to the available data) and Abstracts Views on Vision4Press platform.
Data correspond to usage on the plateform after 2015. The current usage metrics is available 48-96 hours after online publication and is updated daily on week days.
Initial download of the metrics may take a while.